

Analytics & value-based care
Oncology Analytics Software
See why oncology margins, chair use and denials move: by drug, regimen, payer, site and quarter.
Oncology Analytics Software shows the measures a medical oncology practice runs on, and why they change: drug margin by product and payer, infusion chair use, denials by cause, and new-patient volume. It traces each number back to the claims and doses behind it, so leaders can see what moved and fix the cause.


 6,500+ specialty providers

Analytics in a Oncology Practice
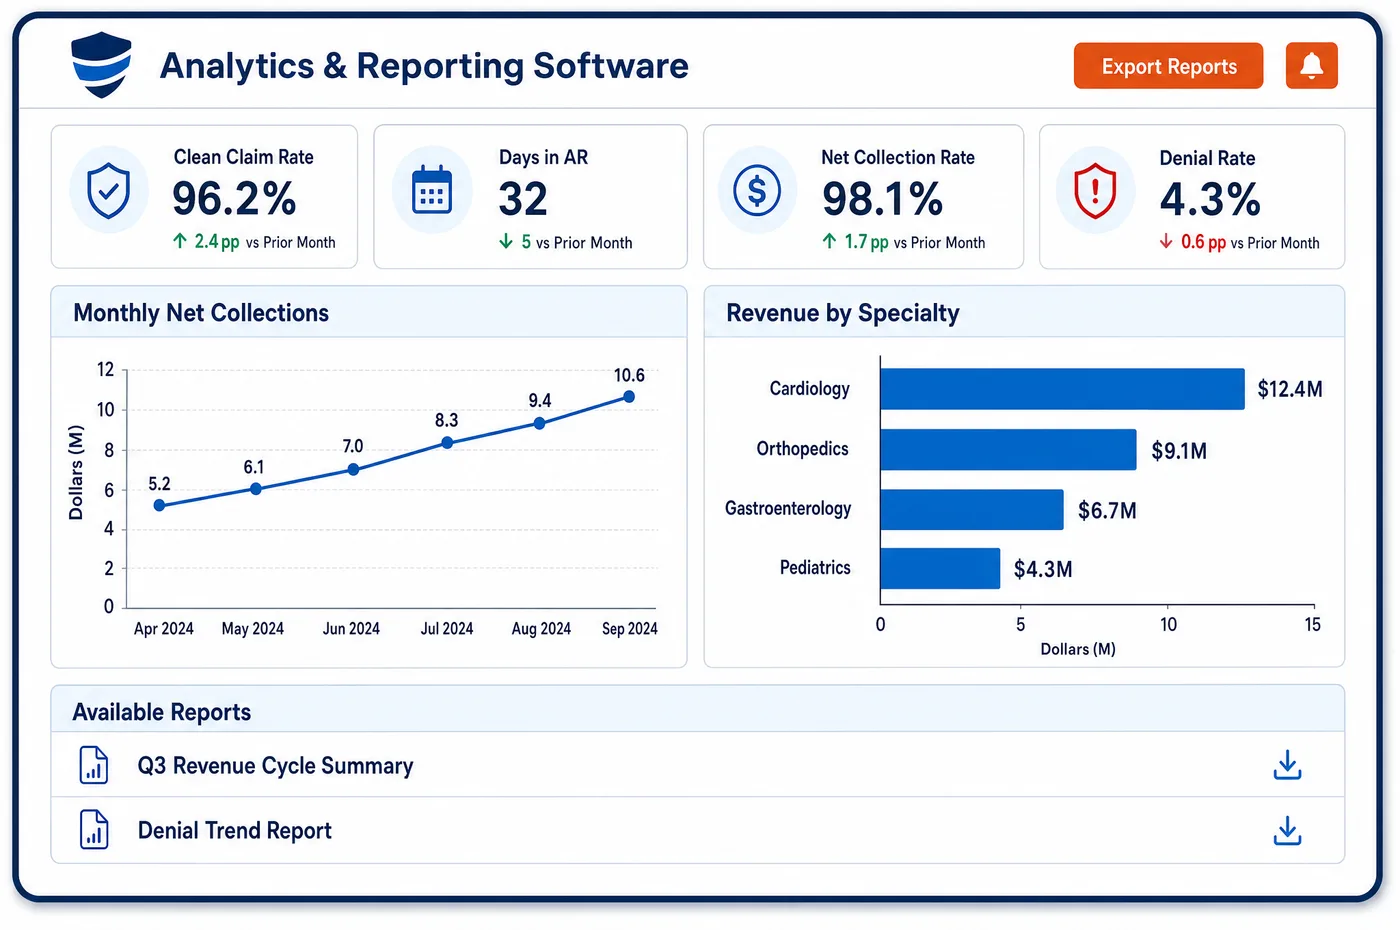
Numbers in medical oncology move for reasons a plain total can't show. Drug margin can fall because CMS reset an ASP limit, a payer changed a contract, or the practice switched from a reference product to a biosimilar. Denials can rise because one payer began checking regimens against its own policy. Oncology analytics pulls clinical, scheduling and billing data into one model, so each change can be broken down by drug, payer, site, provider and quarter. Staff can set up a report that groups patients by a field on the record, such as the drug or cancer type, and compare margin and denials across the groups. Infusion chair use is shown by hour and site next to the visit mix. Benchmarks compare the practice with regional and national specialty peers. Every figure traces back to the source transaction, and the same numbers feed scheduled oncology reports.
Why Is Analytics Different in Oncology?
Most oncology revenue arrives as drug payment, and most cost goes out as drug purchase. That makes margin very sensitive to small changes in price and payment. A quarterly ASP update, a new biosimilar, or a payer's site-of-care policy can shift the margin on one drug while the practice total looks steady. Analytics has to work at the level of the drug and the payer to catch it.
Capacity is the other limit. Chairs, nurses and pharmacy prep time cap how many patients a practice can treat in a day. Long infusions hold a chair for much of the day, while short injections turn fast. Knowing which regimens fill which hours tells the practice whether it needs more chairs, a new schedule template or a different visit mix.
Oncology analytics also has to explain, not just count. A rise in denials matters less than the reason: a new prior authorization rule, a unit edit, or an off-label use the payer won't accept. When each trend opens down to the claims behind it, the billing manager knows where to act, and oncology dashboards can give each role the right view.
What Oncology Analytics Software Handles
- Quarterly ASP resets and margin swings
- CMS updates Part B payment limits each quarter from manufacturer ASP data. Margin trends mark each quarter's change, so leaders can tell a price reset from a payer or coding problem. (CMS: Medicare Part B Drug Average Sales Price)
- Administration code mix (initial, sequential, concurrent)
- Under NCCI, only one initial administration code such as 96413 is reported per encounter unless separate IV sites are needed, and 96368 is limited to one unit. Analytics shows the code mix per infusion visit, so drift in how visits are coded stands out. (CMS NCCI Policy Manual for Medicare Services, Chapter XI (Medicine, including Chemotherapy Administration))
- Biosimilar adoption
- Qualifying biosimilars get a higher Medicare add-on for a set period under the Inflation Reduction Act. Use of each biosimilar against its reference product is tracked by payer, next to the margin on each. (CMS: Inflation Reduction Act FAQs, Medicare Part B payment for qualifying biosimilars)
- Discarded drug by product and vial size
- Medicare Part B wants discarded amounts from single-dose containers reported with JW. Trends in billed waste by drug and vial size show where dose rounding or vial choice could cut waste. (CMS: Discarded Drugs and Biologicals (JW and JZ modifiers))
- Off-label denials and compendia support
- Medicare covers off-label anticancer uses supported by listed compendia or peer-reviewed literature. Denials for medical necessity are grouped by drug, diagnosis and payer, which shows where regimens need stronger support on the claim. (Medicare Benefit Policy Manual, Chapter 15, Section 50.4.5: Off-Label Use of Drugs and Biologicals in an Anti-Cancer Chemotherapeutic Regimen)
How Does Oncology Analytics Software Work?
1. Bring the data together
Clinical, scheduling, billing and posting data come into one model through FHIR and database connectors. Doses, claims and payments share the same patient, drug and visit keys.
2. Set the core measures
Drug margin, chair use, denial rate, days in AR and new-patient volume are defined once. Each is broken down by drug, payer, site, provider and patient group.
3. Explain the change
When a measure moves, it can be split into its causes, such as an ASP reset, a contract change or a new denial reason. Each figure opens down to the claims behind it.
4. Compare with peers
Benchmarks set the practice next to regional and national specialty peers on measures like first-pass yield and days in AR. Gaps point to where work will pay off.
5. Feed fixes back
Denial causes found in analytics turn into new claim edits for the scrubber. Margin findings go to the pharmacy and into contract talks.
Oncology Analytics Software vs. Generic Software
| Area | Generic approach | Unlimited Systems |
|---|---|---|
| Drug margin | One margin figure for the whole practice. | Margin by drug, payer, site and quarter. |
| Cause of change | A total that moved with no reason shown. | Change split into price, payer and coding causes. |
| Chair use | Estimated from the schedule. | Measured by hour and site from completed visits. |
| Regimen view | No way to group patients by drug. | Cohorts built from the clinical and financial record. |
| Benchmarks | No outside point of comparison. | Regional and national specialty peers. |
Who Uses It in a Oncology Practice
- Practice administrator: Chair use, visit mix and new-patient volume by site, to plan staffing and templates.
- Billing director: Denials by cause, payer and drug, with each trend opening to the claims behind it.
- Physician owners: Drug margin by product and payer, and a clear read on why it moved this quarter, from the same data used in drug cost accounting.
Oncology Analytics Software FAQs
Oncology analytics usually starts with drug margin by product and payer, because drugs carry most of the revenue and cost. Next come infusion chair use, denial rate by cause, days in AR and new-patient volume by referral source. Each measure should break down by drug, payer, site and provider so the practice can see what drives it.
Drug margin can drop for several reasons at once: a lower ASP limit in the new quarter, a payer paying a lower contract rate, a higher purchase price, or a shift between a reference product and a biosimilar. Analytics splits the change into those parts, so the practice can tell a price reset from a contract or buying problem.
Cohorts are built from the clinical and financial record, and staff set up a report that groups patients by a field such as the drug or cancer type. Margin, denials and chair time can then be compared across cohorts. Treatment choice stays with the oncologist. The comparison helps the practice plan stock, authorizations and capacity for the regimens it gives most.
Chair use is measured from completed visits by chair, hour and site, not just from the schedule. Long infusions and short injections are shown apart, since they use chair time very differently. The practice can see when chairs sit empty and when demand stacks up, which helps with templates and staffing.
Benchmarks compare the practice with regional and national specialty peers on measures such as first-pass yield, days in AR and denial rates. Comparisons use pooled, de-identified data. A gap against peers points to where process changes are most likely to pay off, and the practice's own history shows whether the gap is closing.
When analytics finds a repeat denial cause, such as a unit error on one drug or a missing authorization with one payer, the billing team can turn it into a claim edit. New claims are then checked for that problem before they go out. Trends after the change show whether the fix worked.
Related Oncology Software
Analytics & value-based care
In the revenue cycle
Analytics for related specialties
Sources
- CMS: Medicare Part B Drug Average Sales Price
- CMS NCCI Policy Manual for Medicare Services, Chapter XI (Medicine, including Chemotherapy Administration)
- CMS: Inflation Reduction Act FAQs, Medicare Part B payment for qualifying biosimilars
- CMS: Discarded Drugs and Biologicals (JW and JZ modifiers)
- Medicare Benefit Policy Manual, Chapter 15, Section 50.4.5: Off-Label Use of Drugs and Biologicals in an Anti-Cancer Chemotherapeutic Regimen
GET STARTED
See Unlimited Systems in Action
Whether you're actively evaluating new technology or simply preparing for your next vendor renewal, Unlimited Systems can help you understand where your current workflows may be creating avoidable revenue risk.