

Analytics & value-based care
Diabetes Care Analytics Software
See how the diabetes panel's glycemic results, CGM work, education hours and payments move, and trace each change to the patients and payers behind it.
Diabetes Care Analytics Software shows how a diabetes practice is doing and why its numbers change. It tracks the panel's A1c and GMI results by band, kidney and eye testing, CGM reads billed, education hours used, denials and collections. Each figure drills down to the patients, clinicians and payers behind it.


 6,500+ specialty providers

Analytics in a Diabetes Care Practice
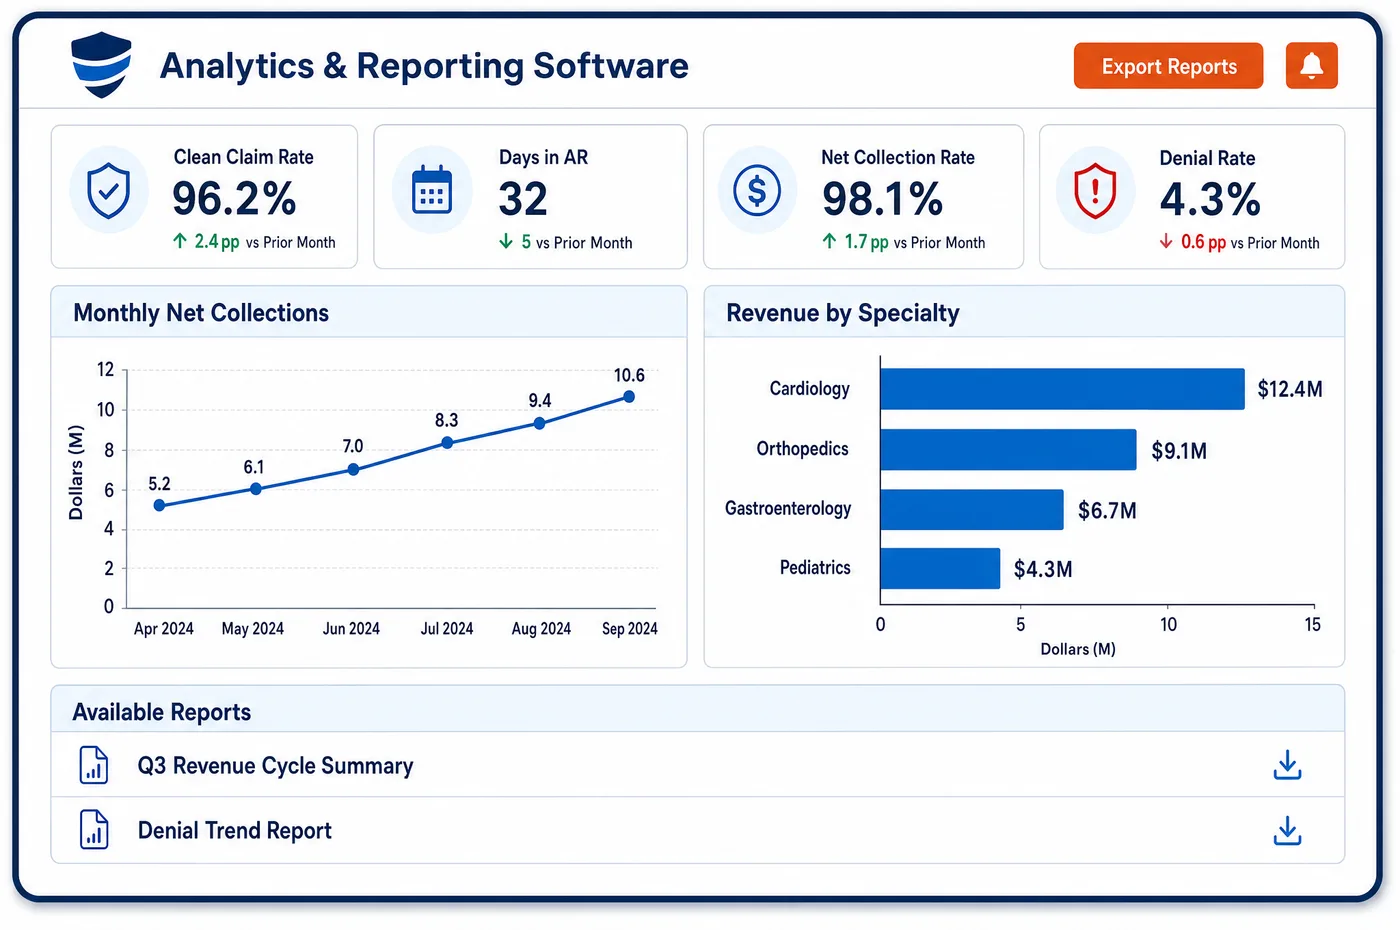
Diabetes care produces two kinds of numbers that leaders need side by side. One is clinical: how many patients have a recent A1c or GMI, how many sit above 9.0, and how many had kidney testing this year. The other is financial: what each service line earns, which payers deny training units, and how much CGM work goes unbilled. Analytics in Unlimited Systems draws both from the same billing and clinical data. A leader can see that the share of patients above 9.0 rose at one site, then open the list and find that many have no result this year at all. A billing manager can see that training denials rose with one payer, and trace them to referrals that lapsed. Trends run by month, site, clinician and payer. Peer benchmarks show where the practice stands on collections and denial rates. The point is to find the cause while it can still be fixed.
Why Is Analytics Different in Diabetes Care?
Glycemic numbers in diabetes care can move for reasons that have little to do with how patients are doing. Under MIPS measure 001, a patient with no A1c or GMI result in the year counts the same as a patient above 9.0. A rise in poor control may simply mean that tests were not done or not recorded. Analytics that splits missing results from high results shows whether the fix is clinical outreach or better data capture.
Device data adds a newer source of results. Both MIPS and HEDIS now accept a glucose management indicator from CGM data alongside a lab A1c. A practice with many patients on CGM may have more recent glycemic results than its lab feed shows. Diabetes care analytics has to count both, with the date each result applies to, or the panel will look worse than it is.
The financial side is spread across many small service lines. Training, nutrition therapy, CGM studies, monthly reads, in-office lab tests and visits each have their own payment rules and denial patterns. A total collections figure hides which of these is slipping. Leaders need to see each line, and to drill into the payer and the reason code when one moves. The diabetes reporting tools then deliver the same figures on a schedule.
What Diabetes Care Analytics Software Handles
- Glycemic bands under MIPS 001
- MIPS 001 sorts each patient's most recent A1c or GMI into bands: below 7.0, 7.0 to below 8.0, 8.0 to 9.0, above 9.0, or missing. The panel view shows each band, so a move between bands is easy to spot. (CMS QPP: 2026 MIPS CQM Quality ID #001, Diabetes: Glycemic Status Assessment Greater Than 9%)
- Missing results count as poor control
- Under MIPS 001, a patient with no A1c or GMI result in the period counts toward the poor-control rate. Analytics splits missing from high results, so outreach goes to patients who simply need a test. (CMS QPP: 2026 MIPS CQM Quality ID #001, Diabetes: Glycemic Status Assessment Greater Than 9%)
- HEDIS glycemic status (GSD)
- The HEDIS GSD measure reports patients 18 to 75 with a most recent A1c or GMI below 8.0 and above 9.0. Health plan HEDIS scores can be checked against the practice's own panel using the same bands. (NCQA: Glycemic Status Assessment for Patients With Diabetes (GSD))
- GMI dates from CGM data
- Health plan guidance says a GMI must be documented with the CGM date range it came from, and the last date in that range is the result date. Analytics uses that date, so a GMI counts in the right year. (Point32Health: HEDIS Tip Sheet, Glycemic Status Assessment for Patients with Diabetes (GSD))
- Kidney health evaluation (KED)
- The HEDIS KED measure looks for both an eGFR and a urine albumin-creatinine ratio in the year, for patients 18 to 85. Patients with one test but not the other are shown as a separate group. (NCQA: Kidney Health Evaluation for Patients With Diabetes (KED))
- Education hours used
- Medicare covers up to ten hours of initial training and two hours of follow-up each year after. Analytics shows how many eligible patients have unused hours, which points to referral or scheduling gaps. (Noridian JF Part B: Diabetic, Diabetes Self-Management Training (DSMT) and Medical Nutrition Therapy (MNT) (updated 2025-07-11))
How Does Diabetes Care Analytics Software Work?
1. Bring clinical and billing data together
Lab results, CGM-derived GMI values, charges and remittances are drawn into one data layer. Each result keeps its date and source.
2. Set the measures and bands
Glycemic bands, kidney and eye testing, education hours and service line revenue are defined once. Every view uses the same definitions.
3. Watch trends by site and clinician
Each measure runs by month, site, clinician and payer. A change at one site stands out against the others.
4. Drill into the cause
From any figure, users open the list of patients, claims or denial reason codes behind it. The cause is visible without a new report.
5. Share what matters
Leaders see the figures on diabetes dashboards, and the same numbers go out in scheduled reports. Everyone works from one version.
Diabetes Care Analytics Software vs. Generic Software
| Area | Generic approach | Unlimited Systems |
|---|---|---|
| Glycemic results | One poor-control rate with no detail. | Bands by MIPS 001 rules, with missing results split out. |
| CGM results | Only lab A1c counted. | Lab A1c and GMI counted, each with its own date. |
| Kidney testing | eGFR alone treated as complete. | eGFR and uACR both required, as KED defines it. |
| Service line revenue | One collections total for the practice. | Training, nutrition, CGM, lab and visits shown on their own. |
| Finding the cause | A new spreadsheet for each question. | Drill-down from any figure to patients and claims. |
Who Uses It in a Diabetes Care Practice
- Medical director: Panel results by band and clinician, with missing results split from high ones, so outreach and care changes go to the right patients.
- Billing manager: Denials and collections by service line, payer and reason code, with drill-down to the claims behind each trend.
- Practice owner: A view of clinical and financial performance by site, with peer benchmarks on collections and denials to show where the practice stands.
Diabetes Care Analytics Software FAQs
Diabetes care analytics sorts each patient's most recent A1c or GMI into the bands MIPS measure 001 uses, from below 7.0 to above 9.0, with missing results shown on their own. Leaders can see each band by site and clinician, and open the list of patients behind any number to plan outreach.
Under MIPS measure 001, a patient with no A1c or GMI result in the period counts the same as a patient above 9.0. A rise in poor control may simply mean tests were missed or not recorded. Splitting missing results from high results shows whether the fix is a test or a change in care.
Both MIPS measure 001 and the HEDIS glycemic status measure accept a glucose management indicator alongside a lab A1c. The GMI should be documented with the CGM date range it came from. Analytics uses the last date of that range as the result date, so the value counts in the right year.
The kidney health evaluation measure requires both an eGFR and a urine albumin-creatinine ratio in the period. Analytics shows patients with both tests, with one test only, and with neither. The one-test group is often the easiest to close, since only the missing test needs to be ordered.
Denials are tracked by service line, payer and reason code. A rise in training denials with one payer shows up as a trend, and users can drill into the claims to see whether the cause is a lapsed referral, a used-up benefit or a same-day conflict with nutrition therapy.
Peer benchmarks compare measures such as collections and denial rates with other specialty practices. The practice's own history is shown next to them. Leaders can see whether a change is a local problem or part of a wider trend among payers.
Related Diabetes Care Software
Analytics & value-based care
In the revenue cycle
Analytics for related specialties
Sources
- CMS QPP: 2026 MIPS CQM Quality ID #001, Diabetes: Glycemic Status Assessment Greater Than 9%
- NCQA: Glycemic Status Assessment for Patients With Diabetes (GSD)
- Point32Health: HEDIS Tip Sheet, Glycemic Status Assessment for Patients with Diabetes (GSD)
- NCQA: Kidney Health Evaluation for Patients With Diabetes (KED)
- Noridian JF Part B: Diabetic, Diabetes Self-Management Training (DSMT) and Medical Nutrition Therapy (MNT) (updated 2025-07-11)
GET STARTED
See Unlimited Systems in Action
Whether you're actively evaluating new technology or simply preparing for your next vendor renewal, Unlimited Systems can help you understand where your current workflows may be creating avoidable revenue risk.