

Analytics & value-based care
Cardiology Analytics Software
See why cardiology revenue moves: test volume by site, component mix, device clinic capture, approval denials and fee schedule shifts.
Cardiology Analytics Software shows how a cardiology practice is performing and why its numbers change. It tracks test volume and revenue by modality, site and component, device clinic billing against the enrolled panel, imaging approval denials by payer, and physician work RVUs, all from the same live data the billing team works in.



 6,500+ specialty providers

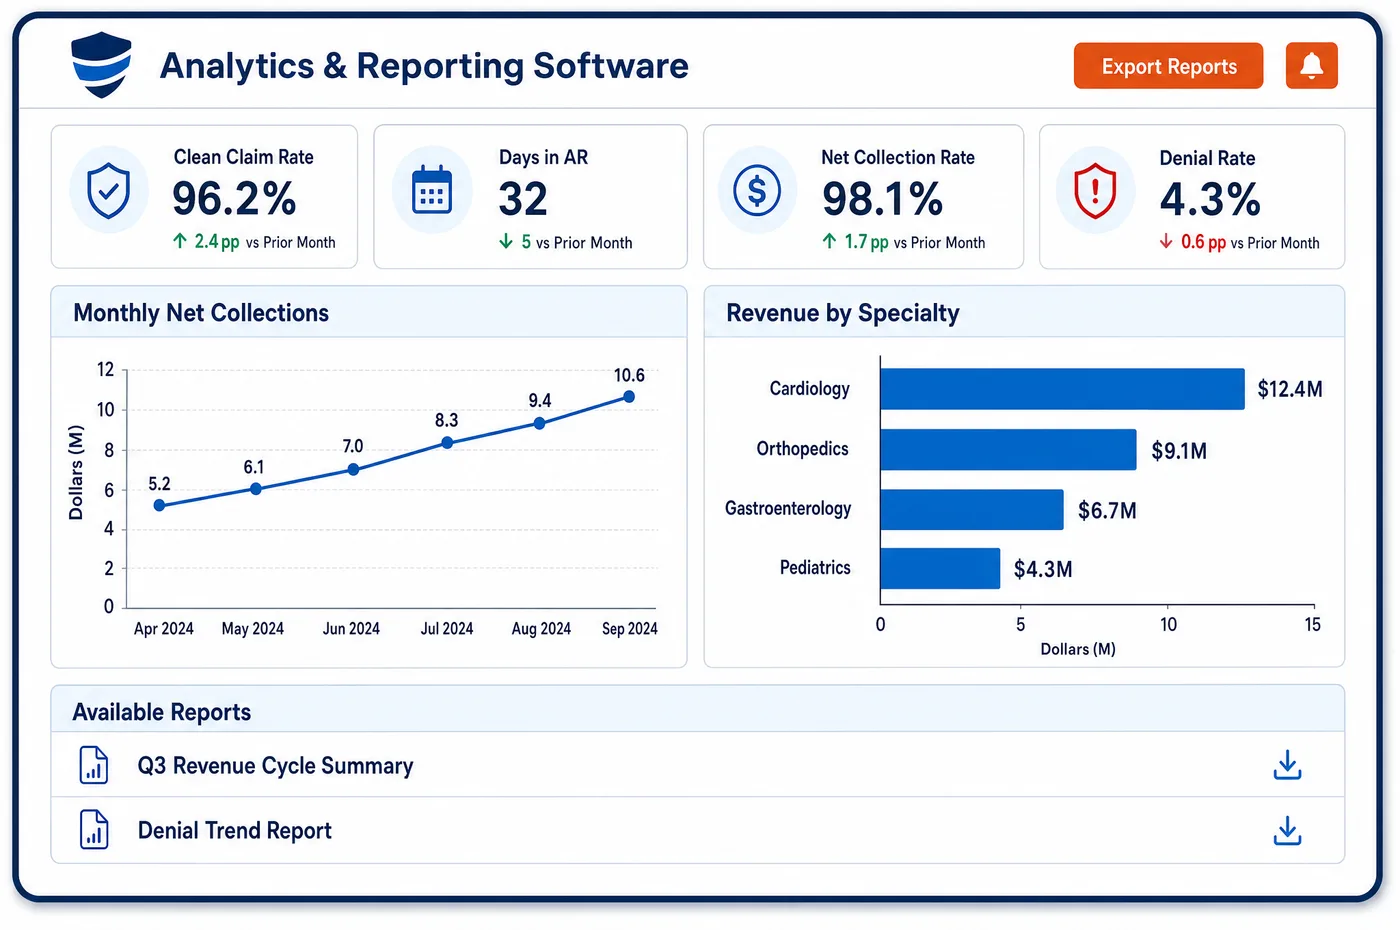
Analytics in a Cardiology Practice
Cardiology revenue can move for reasons no single report shows. If an office echo lab loses volume to a hospital, global revenue falls and professional-only revenue rises. If a plan's benefit manager tightens nuclear approvals, denials for missing approval climb before volume drops. If the device clinic enrolls more patients but bills fewer periods, revenue lags the panel. Cardiology analytics brings scheduling, billing and payment data together so each of these can be traced. Test counts are split by modality, such as echo, stress echo, nuclear, cardiac CT and rhythm monitoring, and by site and component. Each metric can be followed from the total down to the payer, the ordering physician and the claim. Fee schedule changes, such as Medicare's 2026 efficiency adjustment to work RVUs, are easier to see when revenue per test is tracked over time. Leaders can then decide whether the cause is volume, payer behavior or payment rules.
Why Is Analytics Different in Cardiology?
Site of service drives cardiology finances more than in most fields. The same echo can earn the global fee in the office or only the professional fee at a hospital. As referral patterns shift, or as physicians take on more hospital work, the mix changes. A practice total hides that. Analytics in cardiology needs to show tests by site and component, so leaders can tell a volume problem from a mix problem.
The device clinic is a revenue line that is easy to under-measure. Patients enroll in remote monitoring, but billing depends on each period's interpretation being done and charged. If interpretations fall behind, the panel grows while revenue does not. Comparing enrolled patients with billed periods, by device type, shows the gap. The same logic applies to home blood pressure monitoring under the remote physiologic monitoring codes.
Payment rules keep moving, too. Medicare cuts the technical part of a second same-day test, its 2026 rule applied an efficiency adjustment to work RVUs for many non-time-based services, and qualifying APM participants now have their own conversion factor. Analytics that tracks revenue per test and per RVU over time makes those changes visible. The figures behind them should feed cardiology reporting and cardiology dashboards, not live in a separate spreadsheet.
What Cardiology Analytics Software Handles
- Technical, professional and global revenue
- Revenue is split by PC/TC status and site, so leaders see how much of each test line is earned in the office and how much at the hospital. (Medicare Claims Processing Manual, Chapter 12: Physicians/Nonphysician Practitioners (PC/TC indicators))
- Diagnostic cardiovascular MPPR (indicator 6)
- Same-day reductions on technical components are tracked by test and day. A rise in multi-test days shows up as lower revenue per study, not as an unexplained drop. (CMS Recovery Audit Program, Approved Issue 0182: Reduction of Technical Component, Diagnostic Cardiovascular Services)
- CY 2026 efficiency adjustment and two conversion factors
- Medicare's 2026 rule lowered work RVUs for many non-time-based services and began separate conversion factors for qualifying APM participants. Revenue per test and per work RVU is trended before and after. (Federal Register: CY 2026 Medicare Physician Fee Schedule final rule (efficiency adjustment, conversion factors))
- Remote interrogation capture (93294 to 93296)
- Enrolled device patients are compared with billed periods. A Novitas article for Medicare says these codes are reported no more than once every ninety days, which sets the expected billing rhythm. (CMS Medicare Coverage Database, Billing and Coding Article A56602: Cardiac Rhythm Device Evaluation (Novitas))
- CARC 197 and CARC 50 denial trends
- Approval and medical necessity denials are tracked by payer, test and ordering physician. A rise in one plan's approval denials is visible within the month it starts, which feeds a denial rate that can be acted on. (X12 Claim Adjustment Reason Codes)
How Does Cardiology Analytics Software Work?
1. Bring the data together
Scheduling, charge, claim and payment data sit in one place. Hospital-read charges from interfaces join the office data, so every test is counted once.
2. Split by modality, site and component
Each test is tagged as echo, stress, nuclear, CT, rhythm monitoring or device check, and by site and component. Totals can be cut any of those ways.
3. Trend the core measures
Volume, revenue per test, denials, days in AR and device capture are tracked as cardiology KPIs over time. Seasonal and payer-driven changes stand out against the practice's own history.
4. Drill to the cause
From any metric, users go down to the payer, physician, site and claim. A drop in nuclear revenue can be traced to one plan's approvals or one site's schedule.
5. Act and check
Once a cause is found, staff fix the workflow and watch the same metric. The change, or lack of one, shows up in the trend.
Cardiology Analytics Software vs. Generic Software
| Area | Generic approach | Unlimited Systems |
|---|---|---|
| Test revenue | One total for all diagnostic testing. | Split by modality, site and component. |
| Site of service | Not visible in practice totals. | Office and hospital work shown side by side. |
| Device clinic | Revenue tracked, panel ignored. | Billed periods compared with enrolled patients. |
| Denials | One denial rate for the practice. | Approval and necessity denials by payer and test. |
| Payment rule changes | Noticed when the year-end total is lower. | Revenue per test and RVU trended over time. |
Who Uses It in a Cardiology Practice
- Physician owners: A clear split of office and hospital revenue, so decisions about new equipment or sites rest on real data.
- Practice administrator: Trends for each modality and site, with a path from any number to the claims behind it.
- Device clinic manager: Enrolled patients against billed periods by device type, so interpretation backlogs are found while they are small.
Cardiology Analytics Software FAQs
The most useful cardiology analytics split test volume and revenue by modality, site and component. That shows whether the office echo and nuclear labs are busy, how much work moved to hospitals, and what each test earns after payer rules. Denials for missing approval and medical necessity, by payer and test, show where revenue is lost before it is paid.
Compare the number of enrolled device patients with the number of billed monitoring periods, by device type and payer. When billed periods fall behind the panel, interpretations or charges are lagging. Drilling down shows which patients have no claim for a recent period, so staff can find and fix the backlog.
Revenue per test can fall for several reasons. More same-day tests mean more Medicare technical reductions. A shift from office to hospital work replaces global fees with professional ones. Fee schedule changes, such as Medicare's 2026 work RVU efficiency adjustment, can lower payment for many procedures. Trending revenue per test by site and payer shows which one applies.
Physicians can be compared on work RVUs, visits, tests read and procedures, split by site. Because hospital-read work earns only the professional fee, comparing revenue alone can mislead. RVUs and volume by site give a fairer picture, and each number can be traced to the claims behind it.
Denials for missing approval are tracked by plan, test and ordering physician. If one plan's denials rise, or one site's orders lack approvals more often, the trend shows early. Staff can then fix the approval step before more tests are done without one.
Benchmarks put a practice's own numbers in context. A practice can compare its collection rate, denial rate and days in AR against regional and national specialty figures, and against its own history. The most useful comparison is often the practice's own trend, split by site and modality, since cardiology groups differ so much in how they are set up.
Related Cardiology Software
Analytics & value-based care
In the revenue cycle
Analytics for related specialties
Sources
- Medicare Claims Processing Manual, Chapter 12: Physicians/Nonphysician Practitioners (PC/TC indicators)
- CMS Recovery Audit Program, Approved Issue 0182: Reduction of Technical Component, Diagnostic Cardiovascular Services
- Federal Register: CY 2026 Medicare Physician Fee Schedule final rule (efficiency adjustment, conversion factors)
- CMS Medicare Coverage Database, Billing and Coding Article A56602: Cardiac Rhythm Device Evaluation (Novitas)
- X12 Claim Adjustment Reason Codes
GET STARTED
See Unlimited Systems in Action
Whether you're actively evaluating new technology or simply preparing for your next vendor renewal, Unlimited Systems can help you understand where your current workflows may be creating avoidable revenue risk.