

Analytics & value-based care
Ambulatory Surgery Center Analytics Software
See ASC case margin, payer yield, terminated cases and room time by procedure, surgeon and center, and find out why each number moved.
Ambulatory Surgery Center Analytics Software shows where a surgery center makes and loses money, case by case. It joins facility payments, implant and supply cost, terminated cases and room time by procedure, surgeon, payer and center. Leaders can drill from a trend to the cases behind it and see why a number moved.



 6,500+ specialty providers

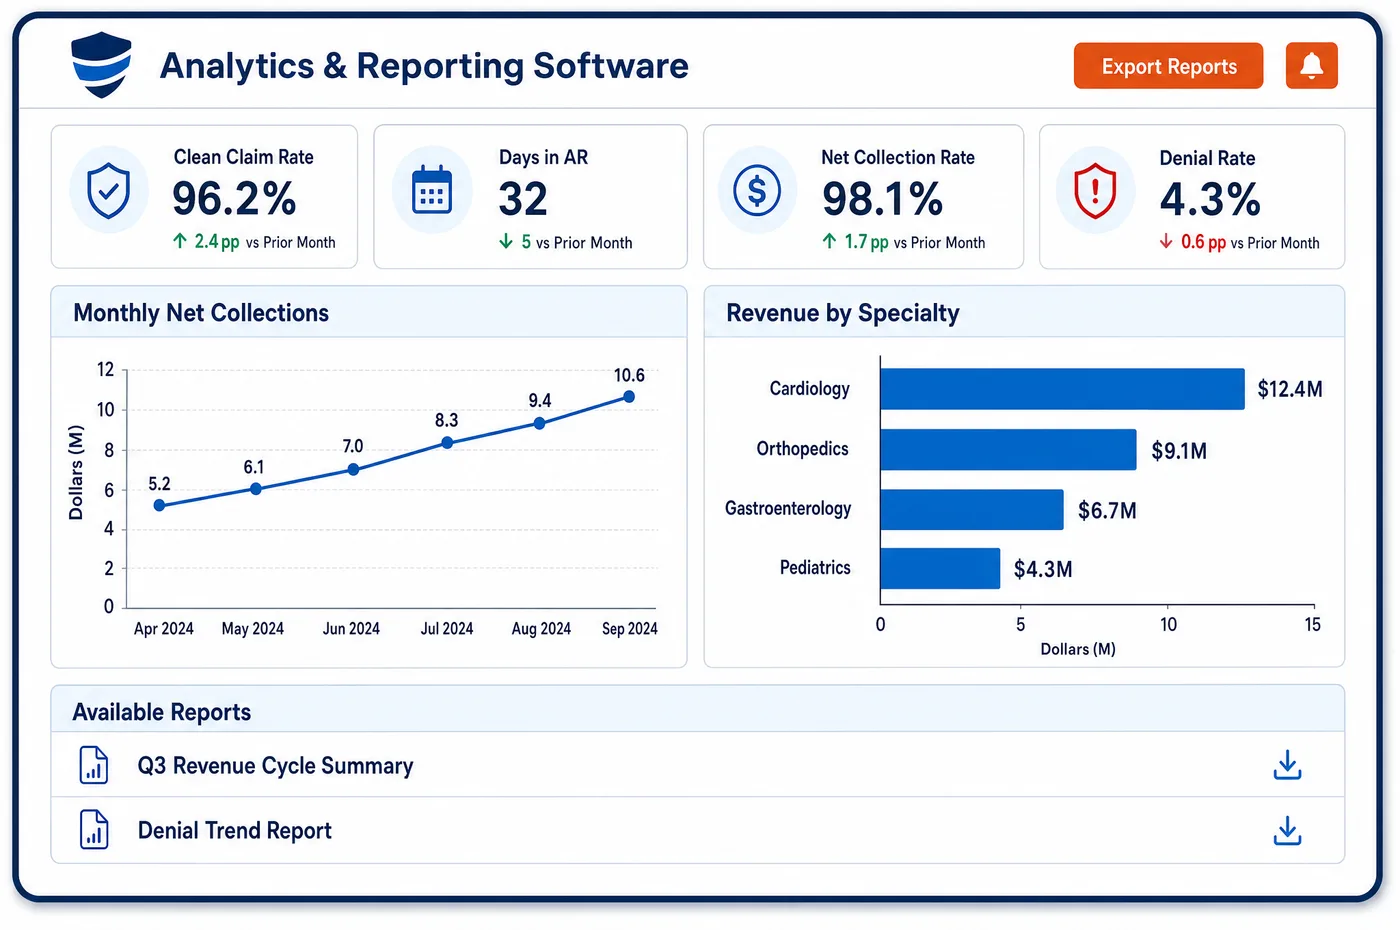
Analytics in a Ambulatory Surgery Center Practice
ASC analytics starts from the case. Each case brings the procedures billed, the payment posted, the implant and supply cost recorded, and the room and turnover time from the schedule. Put together, they give a margin per case that can be grouped by CPT code, surgeon, payer or center. Trends then answer practical questions. Did a payer's case rate slip after renewal? Did a surgeon switch to a costlier implant? Are multiple-procedure discounts cutting more than the contract allows? Did terminated cases billed with modifier 73 rise at one center? Each measure drills down to the payer, the surgeon and the claims behind it. Results can be compared with the center's own history and with peer benchmarks. Charts and drill-downs live in ASC data visualization, and scheduled packets go out through ASC reporting. Analytics is where leaders go to find the cause.
Why Is Analytics Different in Ambulatory Surgery Center?
ASC revenue per case is close to fixed, so margin is set mostly by cost and time. The same procedure can be profitable for one surgeon and a loss for another because of implant choice, supply use or longer room time. Totals hide that. Analytics in an ASC has to work at the level of the case, then roll up to procedure, surgeon and payer.
Payment rules move the numbers in ways a total can't explain. Medicare's multiple-procedure discount pays the extra procedures at half rate. Most implants and supplies are packaged into the procedure payment, so their cost lands on the center. Commercial contracts add case rates, carve-outs and their own discount rules, and a shift in payer mix changes all of it at once. A margin change may be a payer change, a coding change or a cost change, and only case data can tell which.
The case list itself keeps changing. For CY 2026, CMS added 289 procedures to the ASC covered procedures list, including 271 codes removed from the inpatient-only list. Each added procedure is a choice about whether the center can do it at a margin. Quality also counts, since CMS calculates claims-based measures of hospital visits after ASC colonoscopy, orthopedic, urology and general surgery cases. Analytics puts those measures next to margin, so growth plans account for both.
What Ambulatory Surgery Center Analytics Software Handles
- Multiple-procedure discount impact
- Medicare pays the highest-paying discounted procedure at its full rate and the others at half. Analytics shows how much each procedure mix gives up to the discount, by payer, so contract talks start from real cases. (Medicare Claims Processing Manual, Chapter 14: Ambulatory Surgical Centers (sections 30.1, 40, 40.4, 40.5))
- Packaged implants and supplies
- Medicare packages implantable items and supplies into the procedure rate, apart from pass-through devices. Case margin subtracts recorded implant and supply cost, so procedures that lose money on cost alone stand out. (Medicare Claims Processing Manual, Chapter 14: Ambulatory Surgical Centers (sections 30.1, 40, 40.4, 40.5))
- Terminated cases (modifiers 73 and 74)
- Cases stopped before anesthesia pay at half the rate, and those stopped after anesthesia began pay in full. Terminated case counts and the revenue they cost are tracked by center and surgeon. (Medicare Claims Processing Manual, Chapter 14: Ambulatory Surgical Centers (sections 30.1, 40, 40.4, 40.5))
- CY 2026 covered procedures list growth
- CMS added 289 procedures to the ASC covered procedures list for CY 2026, including 271 codes removed from the inpatient-only list. Leaders can model which added procedures fit the center's rooms, costs and payers. (CMS fact sheet: CY 2026 OPPS and ASC Payment System Final Rule (CMS-1834-FC))
- Claims-based ASCQR outcome measures
- CMS calculates ASC-12, ASC-17, ASC-18 and ASC-19, which track hospital visits after colonoscopy, orthopedic, urology and general surgery cases, from paid Medicare claims. Analytics sets those results beside volume and margin for the same service lines. (CMS Outpatient Quality Reporting support contractor: Guide to Successful Reporting in the ASCQR Program (CY 2025 reporting period))
- Calendar-year ASC rates
- CMS sets ASC payment rates for each calendar year and updates payable codes each quarter. Rate changes are loaded as they take effect, so trend lines separate a CMS update from a payer or coding change. (Medicare Claims Processing Manual, Chapter 14: Ambulatory Surgical Centers (sections 30.1, 40, 40.4, 40.5))
How Does Ambulatory Surgery Center Analytics Software Work?
1. Join the case data
Payments, adjustments, implant and supply costs, and room times are joined on each case. The case becomes the unit for every measure.
2. Set the measures
Standard key performance indicators include margin per case, net collections, denial rate, terminated cases and days in AR. Each one is defined the same way across centers.
3. Spot the trend
Trends are tracked by month, payer, procedure and surgeon. Shifts that pass a set threshold are flagged for review.
4. Drill to the cause
A flagged trend drills down to the payer, the surgeon and the claims behind it. Staff can see whether payment, cost or coding drove the change.
5. Compare with history and peers
Each center is compared with its own history and with peer benchmarks. The widest gaps point to the first place to dig.
6. Act and recheck
Findings go to their owner, such as contracting, materials management or the business office. The same measure then shows whether the fix worked.
Ambulatory Surgery Center Analytics Software vs. Generic Software
| Area | Generic approach | Unlimited Systems |
|---|---|---|
| Margin | Estimated from monthly totals. | Built from each case's payment, implant cost and supply cost. |
| Trend causes | Guessed from the profit and loss statement. | Drilled down to the payer, surgeon and claims behind the change. |
| Implant choices | Seen only in purchasing reports. | Shown beside payment by surgeon and procedure. |
| New procedures | Added because a surgeon asked. | Modeled for cost, payer rates and room time first. |
| Quality | Reviewed apart from finance. | Claims-based outcome measures shown beside margin. |
Who Uses It in a Ambulatory Surgery Center Practice
- Administrator: Margin per case by procedure, surgeon and payer, with a drill-down to the claims behind every change.
- Materials manager: Implant and supply cost by surgeon and procedure, so product talks with surgeons rest on case data.
- Physician owners and board: Center results that tie to ASC accounting, plus models for adding procedures from the covered procedures list.
Ambulatory Surgery Center Analytics Software FAQs
ASC analytics measures margin per case, payer yield, denial rates, terminated cases, room time and days in AR. It joins payments with implant and supply cost and schedule data, then groups the results by procedure, surgeon, payer and center. Leaders see both what changed and the cases that caused the change.
Margin per case starts with the facility payment posted for the case, including any separately paid devices or drugs. Recorded implant and supply cost is subtracted, and room time from the schedule can be added as a cost driver. Because Medicare packages most implants into the procedure rate, a costly implant lowers margin directly.
Multiple-procedure discounts can be measured by comparing what each line would pay at its full rate with what it was paid. Under Medicare, the extra procedures in a session pay at half. Grouping that gap by payer and procedure shows where discounts cost the most and whether a payer applies them as the contract says.
CMS calculates several ASCQR measures from paid Medicare claims, such as hospital visits after colonoscopy and after orthopedic, urology and general surgery cases. Analytics shows those results next to volume and margin for the same service lines. A center can then weigh growth in a service line against its outcomes, not just its revenue.
A group with several centers can compare each one on the same measures, defined the same way. Margin per case, terminated cases, denial rates and payer yield line up side by side. Each center can also be compared with its own history and with peer benchmarks, which helps leaders see whether a gap comes from the center or the market.
When CMS adds procedures to the ASC covered procedures list, analytics helps model each one. Leaders can look at the expected Medicare and commercial rates, the implant and supply cost from similar cases, and the room time the procedure needs. The model shows whether the center can do the case at a margin before it is added.
Related Ambulatory Surgery Center Software
Analytics & value-based care
In the revenue cycle
Analytics for related specialties
Sources
- Medicare Claims Processing Manual, Chapter 14: Ambulatory Surgical Centers (sections 30.1, 40, 40.4, 40.5)
- CMS fact sheet: CY 2026 OPPS and ASC Payment System Final Rule (CMS-1834-FC)
- CMS Outpatient Quality Reporting support contractor: Guide to Successful Reporting in the ASCQR Program (CY 2025 reporting period)
GET STARTED
See Unlimited Systems in Action
Whether you're actively evaluating new technology or simply preparing for your next vendor renewal, Unlimited Systems can help you understand where your current workflows may be creating avoidable revenue risk.