
Analytics & value-based care
Multi-Specialty Analytics Software
Compare departments on the same definitions and learn why a number moved before it becomes a problem.
Multi-Specialty Analytics Software measures collections, denials, charge lag, AR and provider production for each department on the same definitions, so one specialty can be compared with another fairly. It then helps leaders find why a number moved, by payer, code, provider or location, and not just that it did.



 6,500+ specialty providers

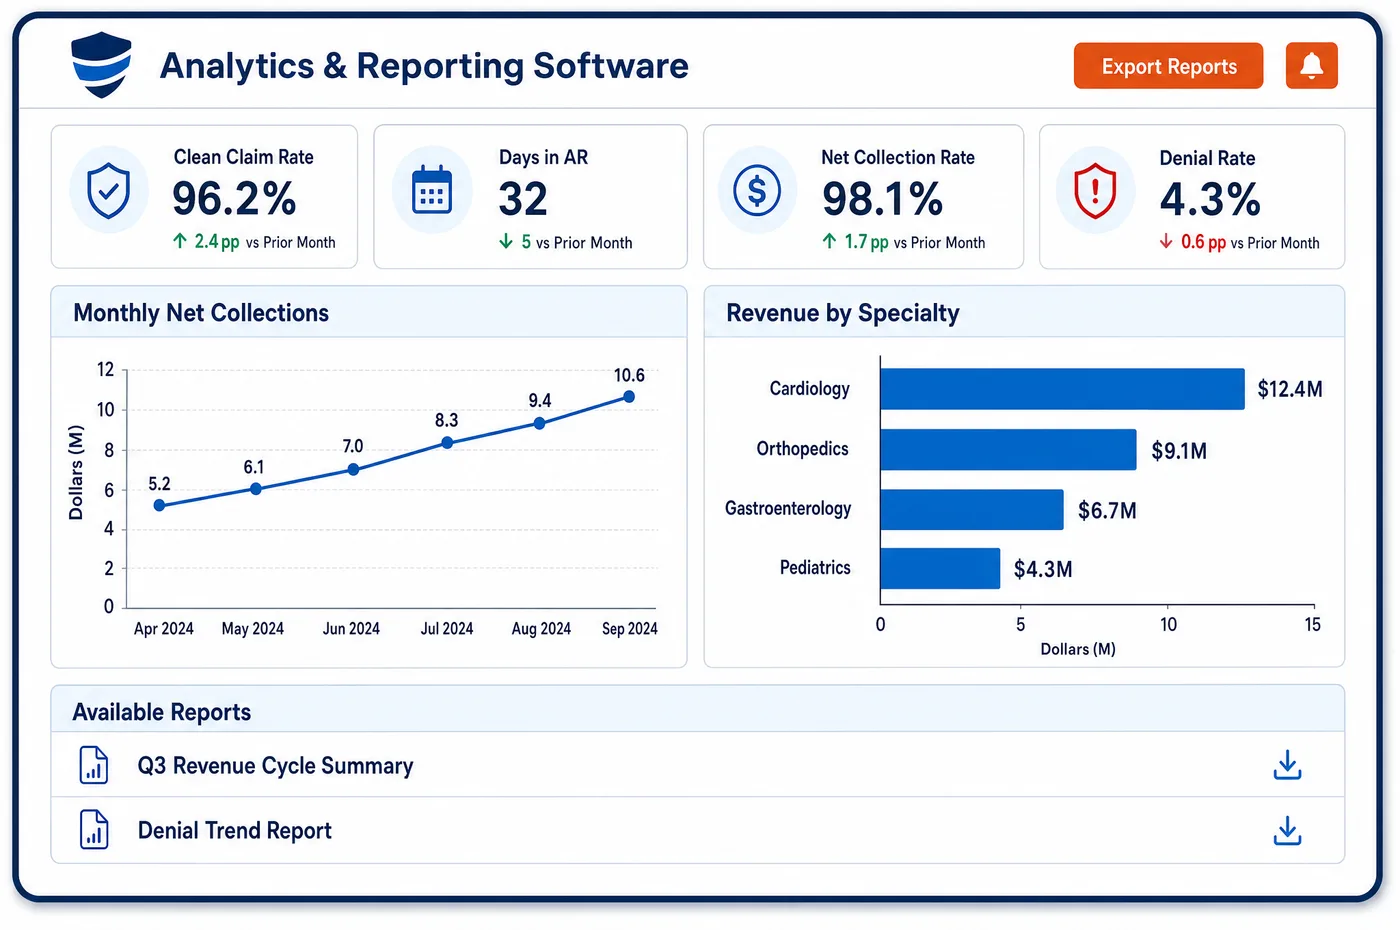
Analytics in a Multi-Specialty Practice
A group total can look steady while one department slides and another carries it. Analytics software breaks the same measures by department, provider, payer and site. Staff can filter without writing queries and can save the views they use most. Denials are grouped by reason and by procedure code, so a pattern in one specialty is not lost among the rest. Production is read in relative value units as well as in dollars, because a department with expensive supplies and one with long visits cannot be compared on revenue alone. Trends show whether a change is new or has been building. Scheduled delivery sends the same view to the same people each period. The practice decides what counts as a clean claim or a day in AR, and then applies that choice to every department. That consistency is what makes a comparison mean something.
Why Is Analytics Different in Multi-Specialty?
The first problem is definitions. Each department often grew up with its own habits. One counts a claim as clean when it leaves the building. Another counts it when the payer accepts it. A third excludes self-pay. A group that compares these numbers is comparing different things. Analytics in a multi-specialty setting begins by setting one definition for each measure and applying it everywhere.
The second problem is mix. A specialty that performs procedures in the office is paid differently from one that works in a hospital, because the Medicare fee schedule sets different practice expense values for facility and non-facility settings. Surgical visits sit inside a global surgical package. Primary care sees many short visits. Revenue per visit alone says little. Analytics must show volume, case mix and place of service next to the dollars.
The third problem is cause. Net collections drop, and the group needs to know why. It could be a payer that changed a rule, a provider who left, a new location with slow charge entry, or a modifier error in one department. Without cuts by payer, code and provider, managers argue about opinions. With them, they can see where the line bends.
What Multi-Specialty Analytics Software Handles
- Relative value units
- The Medicare fee schedule publishes work, practice expense and malpractice RVUs for each code, with separate practice expense values for facility and non-facility settings. Analytics reports work RVUs by provider and department, and shows place of service so comparisons are fair. (CMS: Physician Fee Schedule relative value files)
- Denial reason mix
- Remittances report why a line was adjusted with claim adjustment reason codes. Grouping them by code, payer and department shows whether a rise in denials comes from medical necessity, missing authorization or coding, which each have a different owner. (X12: Claim Adjustment Reason Codes)
- Claim and remittance data
- Measures are built from the 837 claims and 835 remittances that HIPAA adopts as standards. A clean claim rate and days in AR only compare departments when each counts them the same way. The group writes each definition down once and applies it everywhere. (CMS: HIPAA adopted standards and operating rules (837, 835))
- MIPS group and individual scores
- A MIPS group is a single Tax ID with two or more clinicians who have reassigned billing rights to it. Group data covers all clinicians billing under that Tax ID, and the group score can apply to each of them. Analytics shows which clinicians and departments move the group score. (CMS Quality Payment Program: Individual, group and subgroup participation)
- Global surgical package
- The fee schedule relative value file lists a global period for each procedure code. Related follow-up care in that period is part of the payment under Medicare. Analytics separates global-period visits from billable visits, so a surgical department's visit count is not mistaken for lost revenue. See global surgical package. (CMS: Physician Fee Schedule relative value files)
How Does Multi-Specialty Analytics Software Work?
1. Set the definitions
The group agrees on how each measure is counted, such as clean claim rate, days in AR, charge lag and net collection rate. The definitions are written down and applied to every department.
2. Build department views
Staff filter by department, provider, payer, location and date. Saved views make the weekly review the same each time.
3. Find the cause
When a figure moves, staff cut it by payer, code and provider until the source shows. Denials are grouped by reason so the right owner can act. Data visualization makes these cuts quick to read.
4. Check mix and place of service
Volume, case mix and place of service are read beside dollars. This separates a real loss from a change in the kind of work done.
5. Deliver on a schedule
The same views go to the same people each period through reporting. A department lead sees their own figures, and the director sees all of them.
6. Act and recheck
Each finding gets an owner and a follow-up date. The next review checks whether the measure moved back.
Multi-Specialty Analytics Software vs. Generic Software
| Area | Generic approach | Unlimited Systems |
|---|---|---|
| Definitions | Each department counts its own way, so comparisons mislead. | One written definition per measure, applied to every department. |
| Cutting a number | Staff export to spreadsheets and merge them by hand. | Dashboards filter by department, provider, payer and site without queries. |
| Denial insight | One denial figure for the entire group. | Denials by reason, code, payer and department. |
| Productivity | Revenue per visit only. | Work RVUs, volume and place of service next to dollars. |
| Review rhythm | A monthly deck built by hand. | Scheduled views that update from the live account data. |
Who Uses It in a Multi-Specialty Practice
- Physician owner: A short list of measures for each department, so a decision about a service line rests on its own results and not the group average.
- Department chair: Own-department denials, production and AR with the cause shown, so a conversation with the billing team starts from facts.
- Billing director: Group-wide variance on shared definitions, with the claims behind each gap, so effort goes where the loss is. See healthcare accounting for the ledger side.
Multi-Specialty Analytics Software FAQs
Analytics software applies one definition to each measure, then breaks it by department, provider, payer and location. A specialty with slow charge entry or high denials stands out against the others, and managers can open the claims behind it. Without shared definitions, the comparison itself would be wrong.
Dollars hide differences in work. A department with costly supplies and one with long visits cannot be judged on revenue alone. Work relative value units, which the Medicare fee schedule publishes for each code, measure the physician work performed. Read next to dollars, they show who is productive and who is underpaid.
Often yes, if the data can be cut by payer, code, provider and location. A drop may trace to one payer's rule change, one department's modifier error or a new site's slow charge entry. Cutting the number until one cause stands out is faster than debating several theories.
A MIPS group is one Tax ID with two or more clinicians, and group data covers all of them. Analytics shows which clinicians and departments move the group's scores, so leaders can focus on the measures that need attention before the reporting period ends and not after it.
Start with a few measures that every department can count the same way: clean claim rate, days in AR, denial rate, charge lag and net collections. Add production in relative value units. A short list with firm definitions is more useful than many measures that each department reads differently.
Analytics asks why a number moved and what to do about it. Reporting produces the fixed documents that go to leaders, payers or regulators on a schedule. Both draw on the same data. A good analytics finding often becomes a standing report once the group decides to watch it each period.
Related Multi-Specialty Software
Analytics & value-based care
In the revenue cycle
Analytics for related specialties
Sources
GET STARTED
See Unlimited Systems in Action
Whether you're actively evaluating new technology or simply preparing for your next vendor renewal, Unlimited Systems can help you understand where your current workflows may be creating avoidable revenue risk.