
Analytics & value-based care
Multi-Specialty Data Visualization Software
Give each chair, controller and physician owner a live view of their own department, with a click through to the accounts behind it.
Multi-Specialty Data Visualization Software shows department performance as live dashboards: collections, denials, AR aging and provider production, each with a path from the chart to the accounts behind it. Each role opens a view built for its job, and nobody has to wait for an export to see where the group stands today.



 6,500+ specialty providers
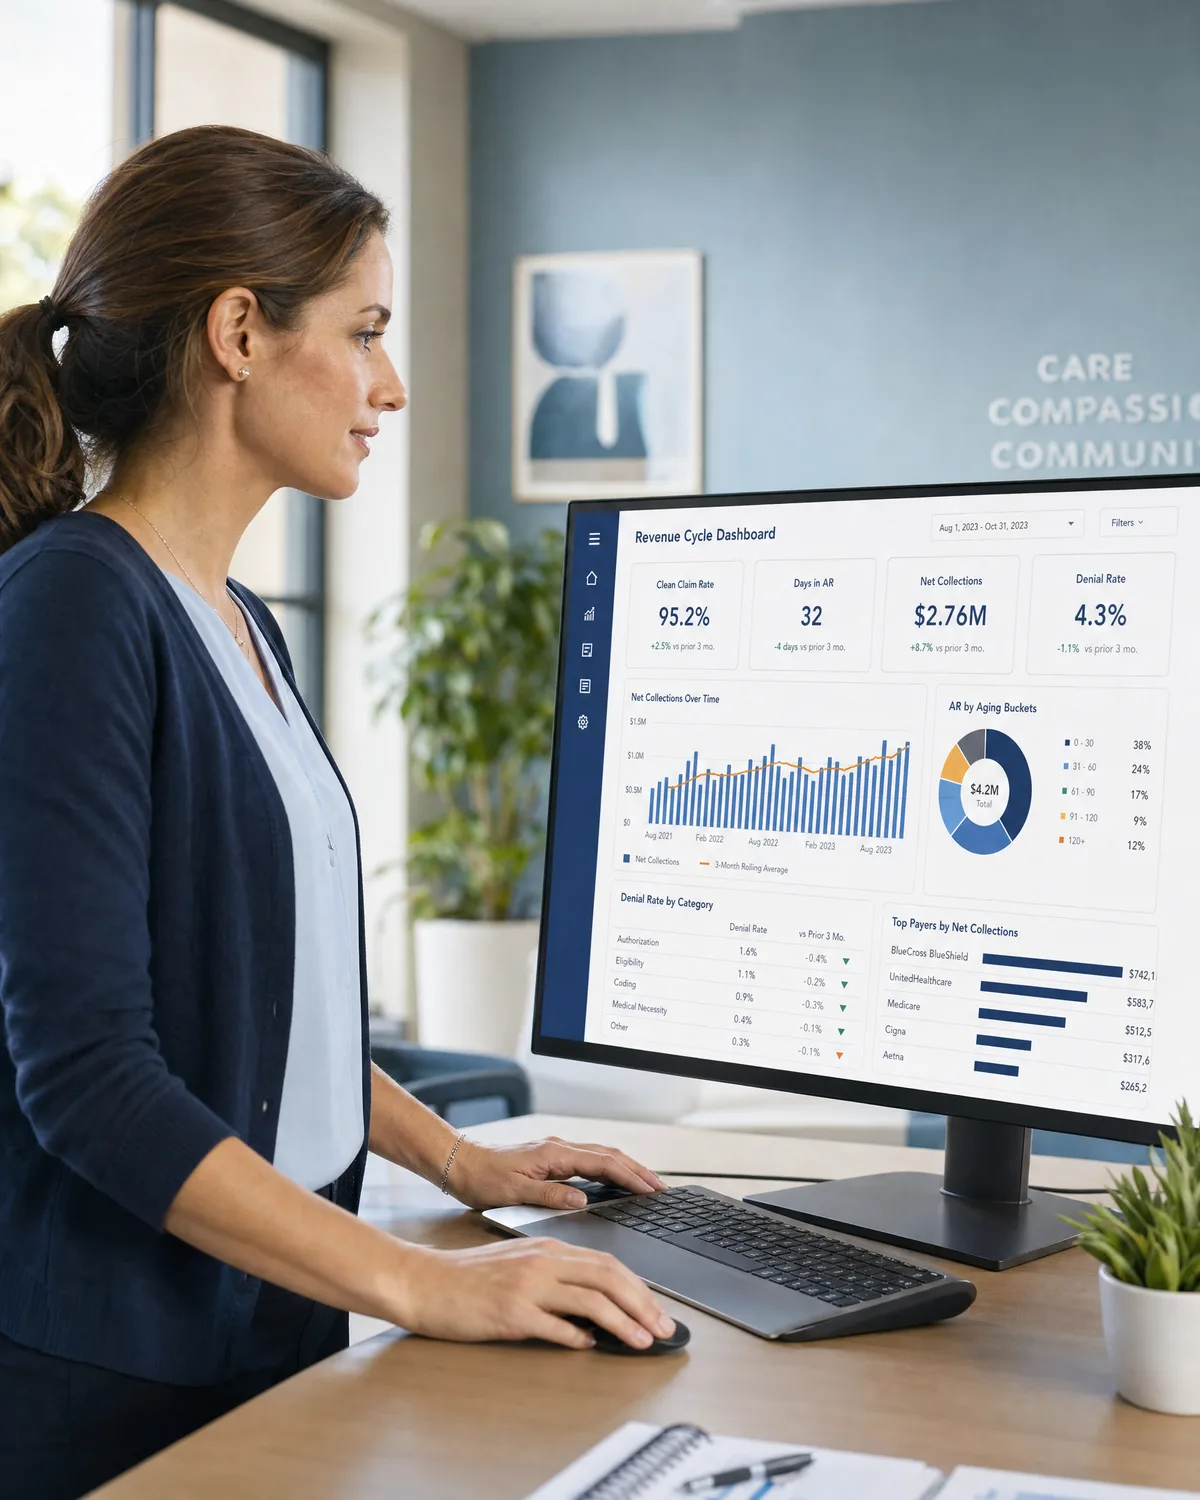
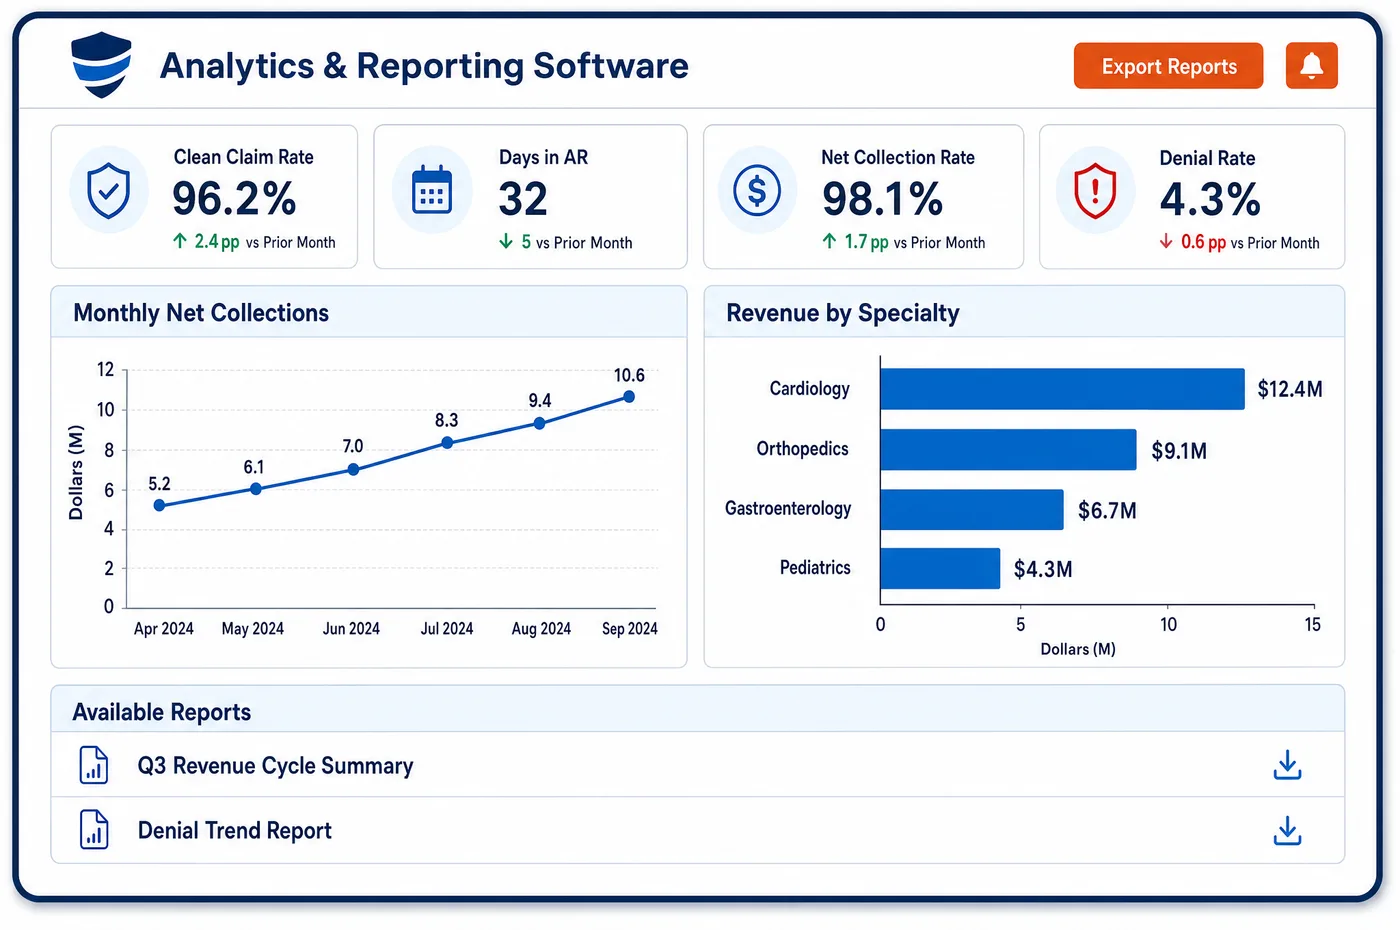
Data Visualization in a Multi-Specialty Practice
A multi-specialty group has more readers than a chart can serve. The chief executive wants the whole group on one screen. A department chair wants only their own service line. A billing lead wants the list of accounts that need work today. Data visualization software draws every RCM dashboard view from a live connection to the same database, so the chart in the boardroom and the worklist at the desk agree. Standard dashboards are ready to use, and custom ones cover the questions unique to the group. Trend tools show whether a measure has been drifting. Each chart links to the accounts under it, so a spike in denials opens the claims behind the spike. History is kept as events and never overwritten, so a chart can be checked against how an account looked on an earlier date. Role settings decide who sees which department.
Why Is Data Visualization Different in Multi-Specialty?
Dashboards in a single-specialty practice answer one set of questions. In a multi-specialty group, the same screen has to serve people with very different jobs. If everyone gets the same dashboard, a chair scrolls past other departments to find their own numbers, and a clerk sees financial data that has no bearing on their work.
Access matters because of privacy rules. HIPAA's minimum necessary standard asks a practice to limit the health information people use to what their job needs. A dashboard that shows patient-level detail to everyone is a risk. Role-based views let a chair see department totals, a collector see account lists and a controller see cash, each with only what the role needs.
Live data matters because groups act on trends. A view built from a nightly export is already behind when a chair reads it. A chart that cannot lead to the accounts behind it wastes the reader's time, since the next question is always which claims. Charts must also read clearly. Color alone should not carry meaning, and chart marks need enough contrast, as accessibility guidance for the web explains.
What Multi-Specialty Data Visualization Software Handles
- Role-based department views
- The minimum necessary standard at 45 CFR 164.502(b) asks a covered entity to limit uses of health information to what is needed. Views are set by role and department, so a chair opens summary figures for their service line and a collector opens account lists. Settings for each role are written down and reviewed. (eCFR via Cornell LII: 45 CFR 164.502, Uses and disclosures (minimum necessary))
- Production charts in work RVUs
- Relative value units for each code come from the Medicare fee schedule files. A production chart that plots work RVUs by provider and month gives a fairer picture than dollars alone, since visit length and supplies differ between departments. The same measures also feed reporting for the compensation committee. (CMS: Physician Fee Schedule relative value files)
- Color and contrast
- Accessibility guidance says color must not be the only way to convey information, and that chart parts need enough contrast with their background. Dashboards use labels, shapes or patterns beside color, so a reader with color blindness can still tell one department from another. (W3C: Understanding WCAG 2.2, Use of Color)
- Chart marks and contrast
- Non-text contrast guidance covers parts of graphics needed to understand content. Lines, bars and legends should stand out from the page. Staff check new custom dashboards against that guidance before they are shared. (W3C: Understanding WCAG 2.2, Non-text Contrast)
- Drill-down to the account
- A drill-down from a chart opens patient-level accounts, so it falls under the same minimum necessary limits as any other use. Only roles that work accounts get the link below the summary. Analytics is where those findings are interpreted. (eCFR via Cornell LII: 45 CFR 164.502, Uses and disclosures (minimum necessary))
How Does Multi-Specialty Data Visualization Software Work?
1. Choose the audience
For each dashboard, the group names who reads it and what decision it supports. A chair, a controller and a collector get different starting views.
2. Pick the measures
Each view shows a few key performance indicators with agreed definitions, such as collections, denials, AR aging and production. Fewer measures make a clearer page.
3. Set access by role
Department and role settings decide which totals and which accounts each user sees. Detail below the summary opens only for roles that need it.
4. Add trends and drill-downs
Trend lines show direction over time. Each chart links to the accounts behind it, so a reader moves from a number to a list of claims in one click.
5. Check readability
Staff confirm that labels, shapes and contrast work without color alone. The group tests each dashboard with a person who did not build it.
6. Review and prune
Dashboards nobody opens are retired. Standing reports are added for anything that must be delivered on a schedule.
Multi-Specialty Data Visualization Software vs. Generic Software
| Area | Generic approach | Unlimited Systems |
|---|---|---|
| Data freshness | Charts fed by an overnight extract. | Dashboards read a live connection to the database. |
| History | Overwritten records hide how an account got to its state. | Every change is kept as an event, so earlier states can be checked. |
| From chart to work | A chart shows the problem, then a second report is needed to find the accounts. | Each chart links straight to the accounts behind it. |
| Who sees what | One dashboard for everyone. | Views set by role and department. |
| Custom views | A request to an analyst for each new chart. | Standard dashboards plus custom ones built by the group. |
Who Uses It in a Multi-Specialty Practice
- Department chair: A dashboard of the department's own production, denials and aging, with a link from each chart to the accounts underneath.
- Billing lead: A work-focused view that lists the accounts behind each problem, so the day's effort goes where a chart shows loss. See analytics for how causes are traced.
- Physician owner: A single screen with the group's key measures by department, drawn from live data and not from last month's deck.
Multi-Specialty Data Visualization Software FAQs
Data visualization software shows collections, denials, AR aging and provider production by department as live dashboards, drawn from one database. Each role opens its own view, and each chart links to the accounts behind it. Leaders see the whole group, while chairs and collectors see only what their jobs need.
Yes. Charts include direct links into the accounts in the revenue cycle, so a reader who sees a spike in denials opens the claims, payers and departments behind it. This saves running a second report to find the accounts, and it moves the conversation from the number to the work.
Groups act on trends, and a trend from a nightly export is already out of date. A live connection to the database means the chart in the meeting matches the work queue at the desk. Because history is kept as events, earlier states of an account can still be checked.
The HIPAA minimum necessary standard asks practices to limit the health information people use to what their role requires. Set dashboard access by role and department. Chairs and executives usually need totals, while collectors need account lists. Review those settings on a schedule and when staff change jobs.
Both are useful. Standard dashboards cover common revenue cycle measures from the start. Custom dashboards answer questions specific to the group, such as one service line or one payer contract. Build a custom view only when a standing question needs it, and retire views that no one opens.
Data visualization is the live, on-screen exploration of measures, with drill-downs to accounts. Reporting produces fixed documents on a schedule for committees, payers or regulators. The two read the same data, so a number on a dashboard should match the same number in the report for that period.
Related Multi-Specialty Software
Analytics & value-based care
In the revenue cycle
Data Visualization for related specialties
Sources
GET STARTED
See Unlimited Systems in Action
Whether you're actively evaluating new technology or simply preparing for your next vendor renewal, Unlimited Systems can help you understand where your current workflows may be creating avoidable revenue risk.