
Analytics & value-based care
Diagnostic Imaging Reporting Software
Standard and saved reports for modality volume, technical and professional revenue, referrers and denials, plus the audit and price data an imaging site must keep.
Diagnostic Imaging Reporting Software produces the scheduled and ad hoc reports an imaging business runs on. It covers studies and revenue by modality, technical and professional collections, referrer volume, authorization denials and aging, and it supplies the data behind mammography audits and the hospital's posted prices.



 6,500+ specialty providers

Reporting in a Diagnostic Imaging Practice
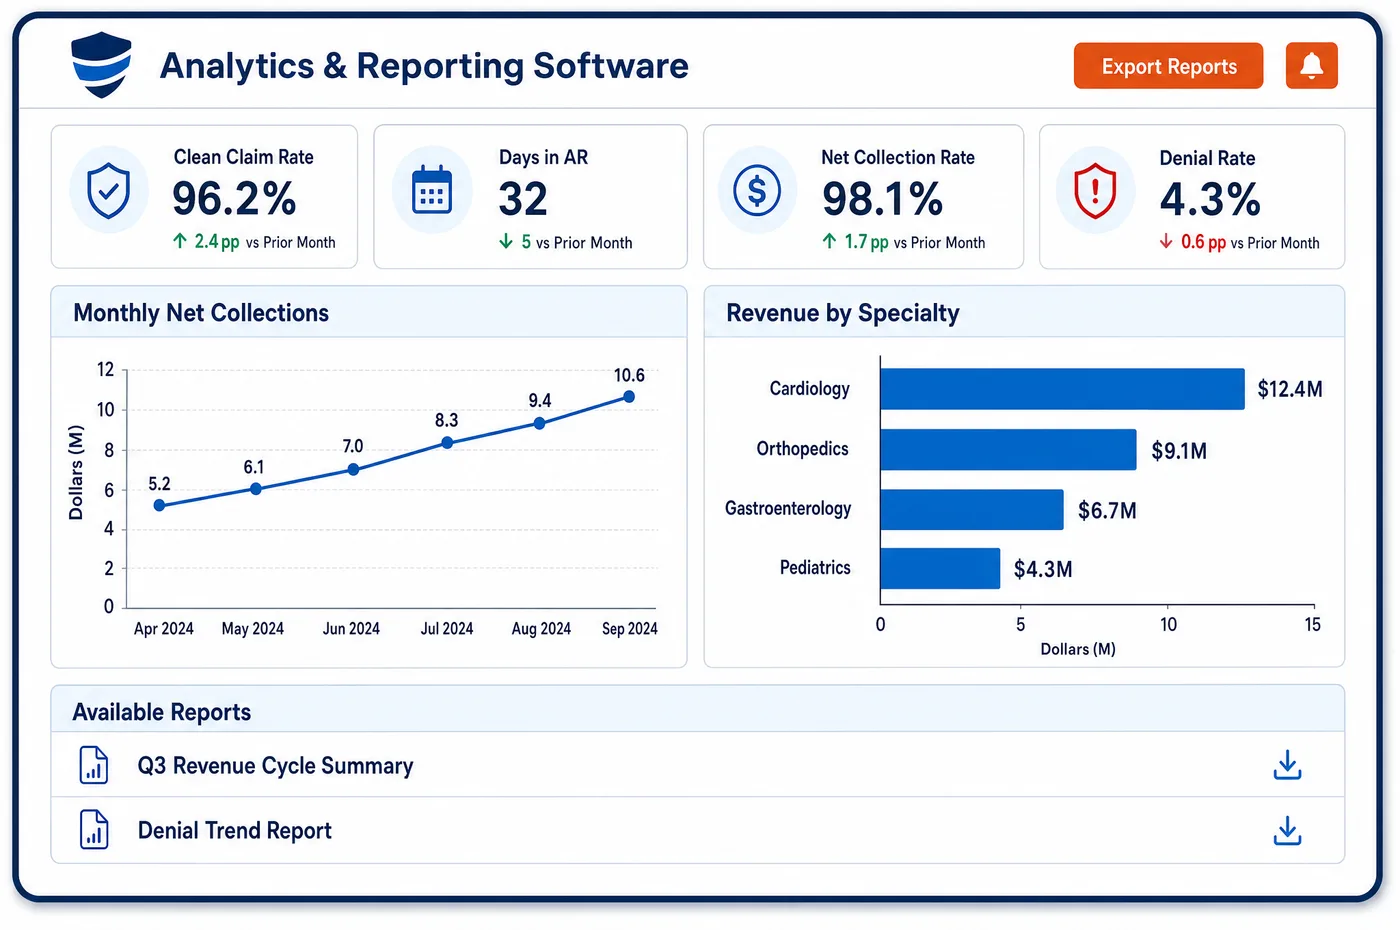
A reporting library for imaging starts with the questions owners ask each month. How many studies did each scanner complete? How much of each payment was for the scan and how much for the read? Which referring practices sent orders, and which of those orders were denied for authorization? Staff run the standard reports as they are, or save a version with their own filters, such as one site, one payer or one modality. Each report can be scheduled and sent to owners, hospital partners or reading group leads in the format they use. Reports draw on the same posted payments and claim lines as the rest of the system, so a total on a report matches the ledger. Regulatory outputs sit in the same library. A mammography site keeps audit data, a hospital department supplies charge data for its price file, and a physician group pulls measure data for MIPS quality reporting. Findings are explained in imaging analytics and shown live on imaging dashboards.
Why Is Reporting Different in Diagnostic Imaging?
Imaging reporting goes wrong when it blends two kinds of revenue. A center that owns the scanner but buys reads from an outside group needs one view of its technical payments and a separate view of what it pays for the reads. A reading group needs the opposite view, built on the professional part alone. Reports that sum every payment under one CPT code hide who earned what. Imaging reports have to split the global, technical and professional parts and keep each entity's totals apart.
Many readers of imaging reporting sit outside the practice. A reading group reports volume to each hospital it covers. A hospital partner wants to see the studies its department sent out. Referring practices ask how many of their orders were completed. Each audience needs the same facts cut a different way, and each needs a schedule that does not depend on one person remembering to run it. Saved reporting definitions with set recipients take that burden off the billing manager.
Compliance adds its own lists. Federal mammography rules require a facility to run a medical outcomes audit that follows positive mammograms to a result. A hospital must keep standard charges for shoppable services, imaging among them, posted for the public. These are not billing reports, but billing data feeds them. Pulling the right studies, dates and charges from the system on request is faster and safer than rebuilding them from aging buckets and spreadsheets each time.
What Diagnostic Imaging Reporting Software Handles
- Mammography audit lists
- Federal rules require a mammography facility to collect and review outcome data, including follow-up of every positive mammogram. Staff run a list of mammograms by assessment, interpreting physician and date, and the audit team adds pathology results from the clinical record. (21 CFR 900.12: Quality standards for mammography, including the medical outcomes audit)
- Charge data for hospital price files
- A hospital must make public the standard charges for shoppable services, and CMS's list includes imaging such as CT head (70450), MRI brain (70553) and mammography (77065 to 77067). Finance staff run a charge report for those codes and check it against the posted file before each update. (CMS Hospital Price Transparency: Steps for making public standard charges for shoppable services (CMS-specified list))
- Referrer reports by ordering NPI
- Claims for ordered imaging must carry the ordering provider's legal name and NPI. A report groups studies, payments and denials by that NPI and practice, which gives the physician liaison a current list to work from. (42 CFR 424.507: Ordering covered imaging and clinical laboratory services)
- Revenue by component (modifiers TC and 26)
- Medicare pays the technical and professional parts of a study separately, and the modifiers show which part a line covers. Revenue reports split posted payments by component and entity, so a center sees scan revenue apart from read revenue. (CMS Medicare Claims Processing Manual, Chapter 13: Radiology Services and Other Diagnostic Procedures)
- Session reduction report (CARC 59)
- Payers use CARC 59 when they cut payment for a later study in one session. A report totals those adjustments by payer and modality, so billing can compare the cuts with each contract rather than treat them as write-offs. (X12: Claim Adjustment Reason Codes)
- Measure data for MIPS
- MIPS radiology measures cover topics such as CT radiation dose and follow-up imaging for incidental findings. Reports list the eligible studies and the data tied to each measure, so the group can review counts before it reports. (CMS Quality Payment Program: Explore MIPS measures)
How Does Diagnostic Imaging Reporting Software Work?
1. Choose the standard report
Staff pick from the library, such as volume by modality, revenue by component, referrer activity, denials by owner or aging by payer. The report opens with the filters the practice set as its default.
2. Filter and save a version
Filters for site, payer, modality, scanner, referrer and date range can be saved under a name. A saved version is shared with the roles that need it, and it feeds the measures shown in imaging analytics.
3. Schedule and distribute
Each report can run on a set schedule and go to named recipients, such as owners, a hospital contact or a reading group lead. Outside recipients get the report and nothing else from the system.
4. Pull regulatory lists
Mammography audit lists, charge extracts for the hospital price file and measure data are run from the same library. Staff add clinical results that live in other systems before the list is used.
5. Tie out to the ledger
Totals on revenue reports are checked against posted payments and the general ledger. A report that does not tie out is fixed at the source before it goes to a partner.
Diagnostic Imaging Reporting Software vs. Generic Software
| Area | Generic approach | Unlimited Systems |
|---|---|---|
| Revenue by component | One total per CPT code, with scan and read mixed together. | Global, technical and professional revenue shown apart, by entity. |
| Referrer reporting | Built by hand from order logs once in a while. | Run from claims by ordering NPI on a schedule. |
| Hospital partner reports | Assembled by a billing lead when a hospital asks. | Saved definitions that go to named contacts on a set schedule. |
| Mammography audit data | Pieced together from the scheduling and billing screens. | A list by assessment, physician and date, ready for the audit team. |
| Price file support | Charges copied from a chargemaster export. | A charge report for the shoppable imaging codes, checked before each update. |
Who Uses It in a Diagnostic Imaging Practice
- Billing manager: Saved reporting on a schedule, with revenue split by component and entity. Repeated payer cuts go on to imaging denial management for review.
- Reading group administrator: Volume and revenue by hospital contract, sent to each hospital contact without a manual build.
- Mammography site manager: A clean list of mammograms by assessment and physician for the medical audit, so staff add results instead of hunting for studies.
Diagnostic Imaging Reporting Software FAQs
An imaging center usually runs study volume by modality and scanner, revenue by component, referrer activity, authorization denials, aging by payer and patient balances. Each is cut by site and payer. Together these reports show whether the scanners are busy, whether referrals hold up and whether payers are paying as contracted.
Reports split posted payments into global, technical and professional parts by modifier and entity. A center that owns the scanner sees its scan revenue apart from the read revenue paid to an outside group. A reading group sees the professional part only. Totals still tie to the ledger.
A reading group saves a report definition for each hospital contract, with the filters for that hospital's sites and studies. The report runs on a schedule and goes to named contacts. Hospital staff see the report and nothing else from the system.
A mammography facility must follow positive mammograms to a result. Billing can list mammograms by assessment category, interpreting physician and date of service. The audit team then adds biopsy and pathology outcomes from clinical records, since those results are not billing data.
Hospital imaging departments can run a charge report for the shoppable imaging codes on the CMS list and compare it with the hospital's posted file. The report does not publish anything on its own. Finance staff use it to find charges that differ before the file is updated.
Measure counts come from reports that list eligible studies and the data tied to each measure, such as the CT study and its dose record. Staff review the counts before the group reports. Gaps are fixed while the encounter is recent, which is easier than correcting records after the year ends.
Related Diagnostic Imaging Software
Analytics & value-based care
In the revenue cycle
Reporting for related specialties
Sources
- 21 CFR 900.12: Quality standards for mammography, including the medical outcomes audit
- CMS Hospital Price Transparency: Steps for making public standard charges for shoppable services (CMS-specified list)
- 42 CFR 424.507: Ordering covered imaging and clinical laboratory services
- CMS Medicare Claims Processing Manual, Chapter 13: Radiology Services and Other Diagnostic Procedures
- X12: Claim Adjustment Reason Codes
- CMS Quality Payment Program: Explore MIPS measures
GET STARTED
See Unlimited Systems in Action
Whether you're actively evaluating new technology or simply preparing for your next vendor renewal, Unlimited Systems can help you understand where your current workflows may be creating avoidable revenue risk.