
Analytics & value-based care
Diagnostic Imaging Analytics Software
Volume, revenue and use by modality and scanner, plus the reasons behind each change: referrers, payer rules, session cuts and fee schedule updates.
Diagnostic Imaging Analytics Software measures how an imaging business performs by modality, scanner, site, payer and referring provider. It tracks study volume, scanner use, revenue per study, authorization denials and patient balances, compares them with past periods and peer groups, and shows why a number moved so leaders can act on the cause.


 6,500+ specialty providers
Analytics in a Diagnostic Imaging Practice
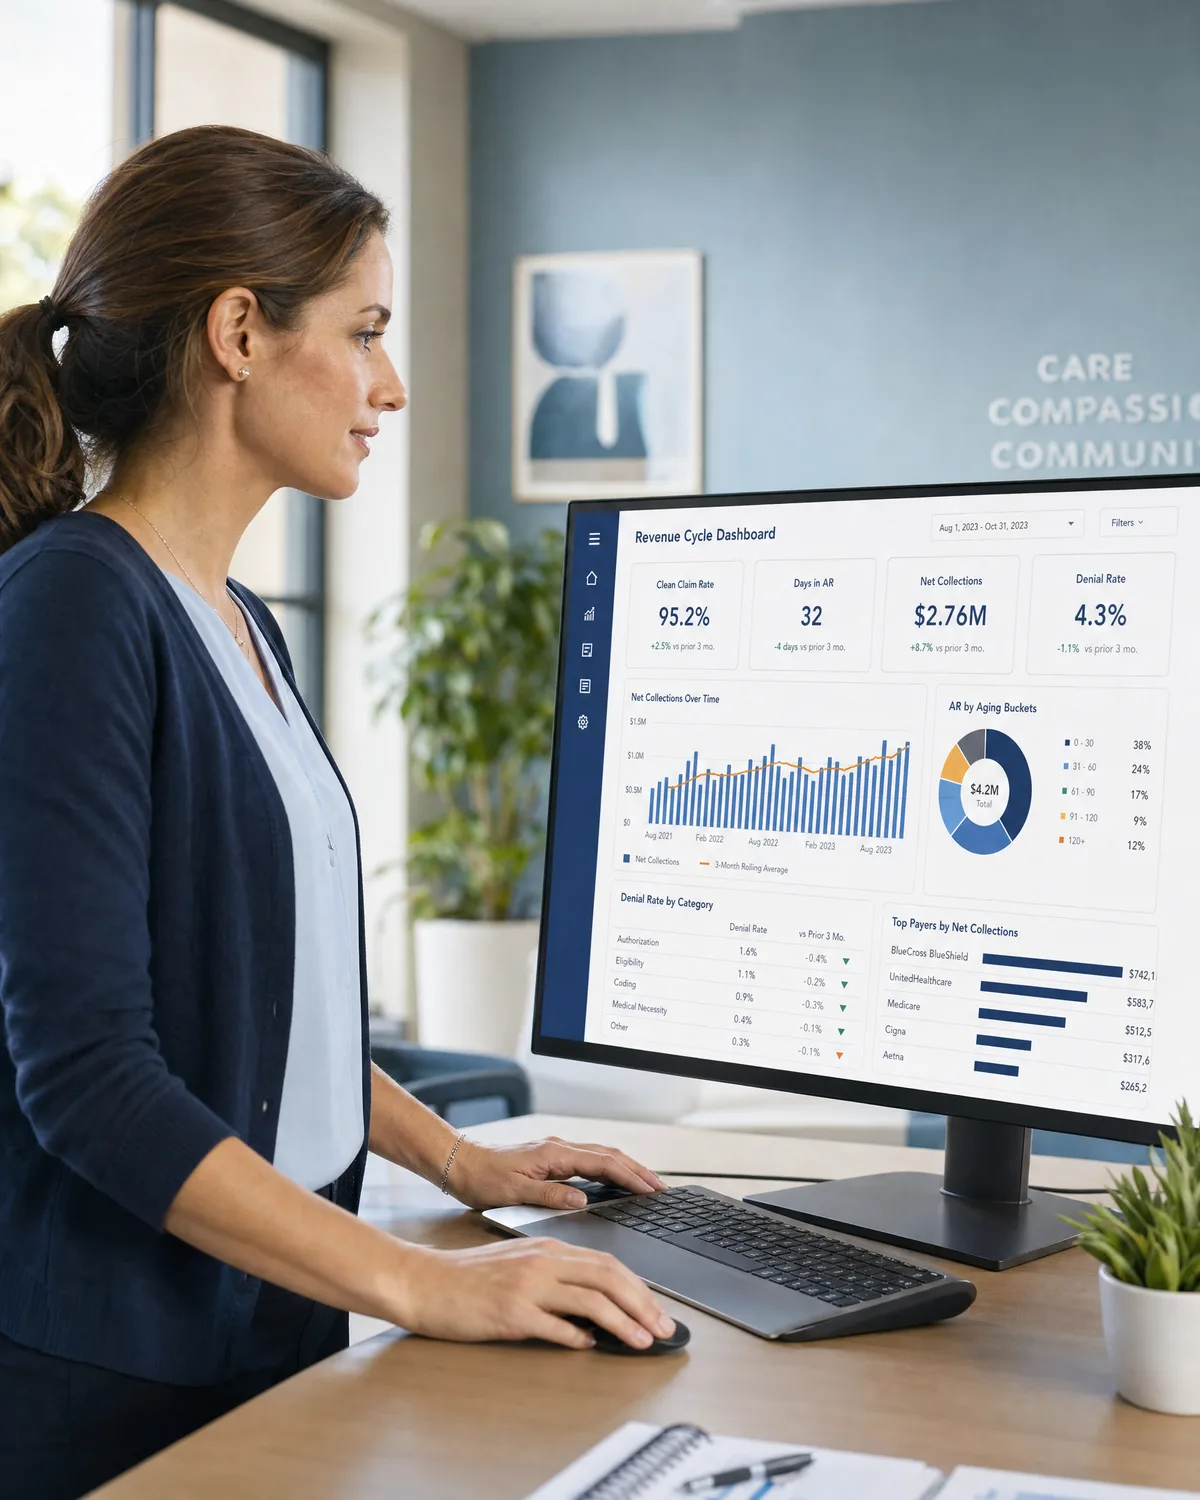
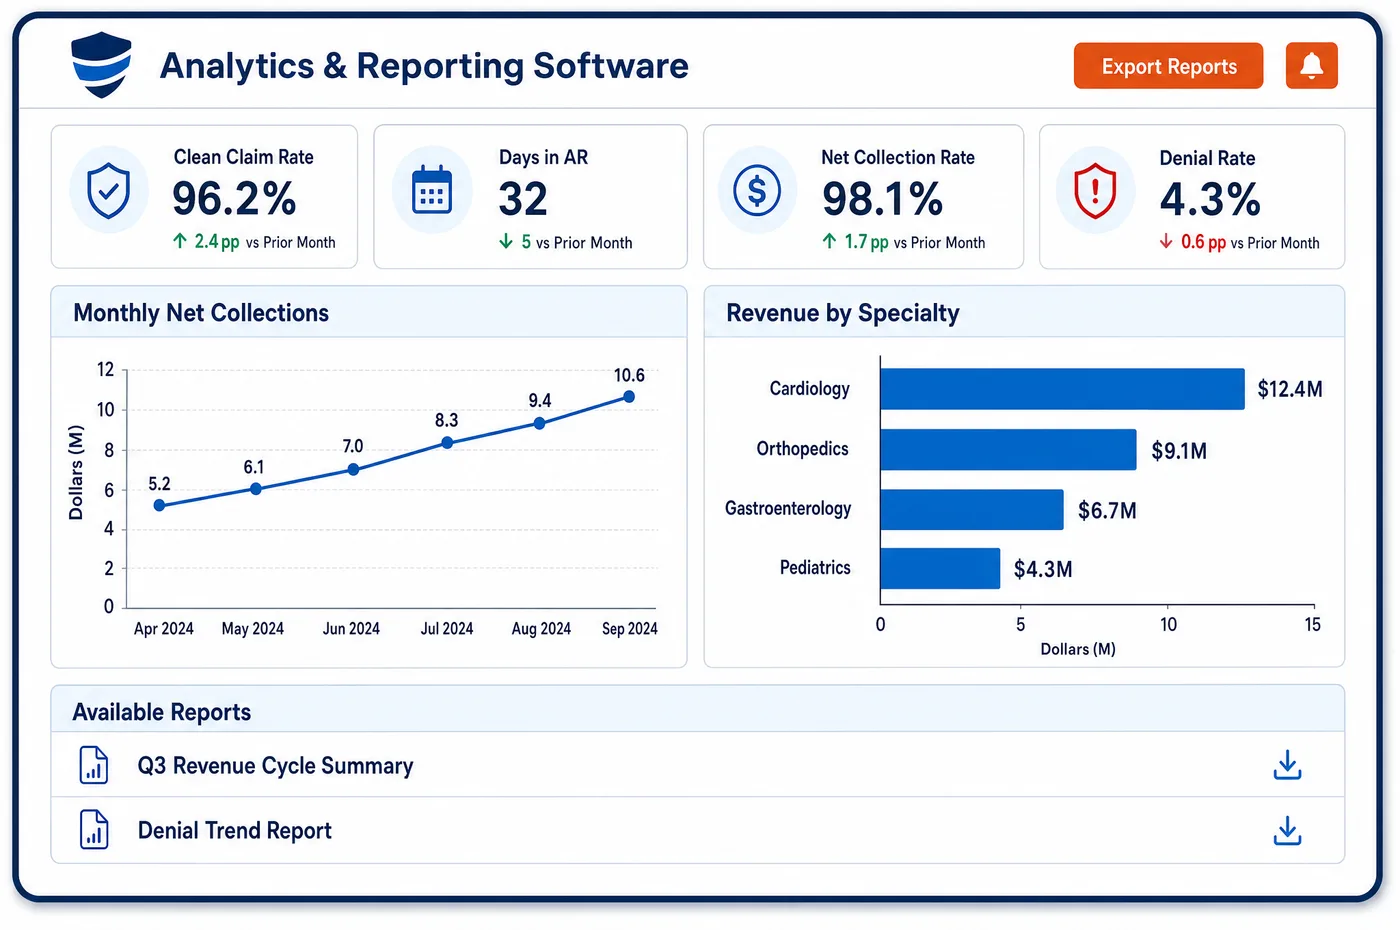
Imaging leaders ask a short list of questions. Is each scanner busy enough to pay for itself? Which referring practices send more studies this quarter, and which send fewer? Did revenue per CT fall because payers paid less, or because more patients had two studies in one session? Analytics for imaging answers these from the same data the billing team uses. Volume comes from completed studies by modality: MRI, CT, ultrasound, mammography, X-ray and nuclear medicine. Use comes from booked and completed scanner time. Revenue comes from posted payments, split into technical and professional parts. Each measure can be cut by payer, site and referrer, and compared with past periods or peer benchmarks. When a number moves, the drivers are laid out next to it: a payer shift, a session reduction, an equipment cut, an authorization trend or a fee schedule change. That turns a chart into a decision about staff, hours, equipment or outreach.
Why Is Analytics Different in Diagnostic Imaging?
Imaging revenue depends on a few fixed assets. An MRI or CT unit costs the same whether it runs all day or half the day. Medicare's fee schedule also assumes costly scanners are busy most of the time. That makes use the first number an imaging owner watches. Analytics has to measure it by scanner, by day part and by modality, and set it next to the revenue each unit brings in.
Referrals drive almost all imaging volume, since every study needs an order from someone else. A referring practice that joins a hospital system or a new imaging competitor can shift volume quickly. Because Medicare requires the ordering provider's NPI on imaging claims, referral data is unusually complete. Imaging analytics can show which referrers are growing, which are fading, and which send studies that are often denied for authorization or coverage.
Payment rules make imaging trends hard to read. A drop in revenue per study can come from more multi-study sessions, a payer moving patients into a benefit manager program, older equipment that triggers cuts, or a new fee schedule year. Each cause needs a different fix. The analytics view has to break a change into its parts and show the payer mix behind it, so leaders do not cut staff when the real issue is a contract.
What Diagnostic Imaging Analytics Software Handles
- Referral volume by ordering NPI
- Medicare claims for ordered imaging must carry the ordering provider's legal name and NPI. Analytics groups volume, revenue and denials by that NPI and its practice, so referral growth and loss show early. (42 CFR 424.507: Ordering covered imaging and clinical laboratory services)
- Scanner use against Medicare's assumption
- Federal law has CMS assume a high utilization rate for costly imaging equipment when it sets payment. Booked and completed time by scanner shows whether each unit runs at the level its payment assumes. (42 U.S.C. 1395w-4 (Social Security Act section 1848): Medicare physician fee schedule, including the special rules for imaging services)
- Session reductions by modality
- Medicare reduces payment for later studies in one session, on both the technical and professional parts. Analytics separates that effect from price changes, so a drop in revenue per CT is traced to the right cause. (42 U.S.C. 1395w-4 (Social Security Act section 1848): Medicare physician fee schedule, including the special rules for imaging services)
- Equipment cuts (modifiers CT, FX, FY)
- CT on equipment that does not meet NEMA XR-29-2013, film X-rays and computed radiography X-rays are each paid less under Medicare. The lost revenue is totaled by scanner and room, which helps justify replacing older units. (CMS Medicare Claims Processing Manual, Chapter 13: Radiology Services and Other Diagnostic Procedures)
- CY 2026 physician fee schedule changes
- For 2026, CMS set two conversion factors, one for qualifying APM participants and one for others, and applied an efficiency adjustment to work RVUs of non-time-based services. Most imaging reads are not time-based, so professional revenue per read is compared year over year with that in view. (CMS Fact Sheet: Calendar Year 2026 Medicare Physician Fee Schedule Final Rule (CMS-1832-F))
- Authorization denial trends (CARC 197, 198)
- Denials for a missing authorization (CARC 197) or a service beyond it (CARC 198) are trended by payer, modality and referrer. A rising rate points to the payer rule or the order pattern that needs attention. (X12: Claim Adjustment Reason Codes)
How Does Diagnostic Imaging Analytics Software Work?
1. Pull the data together
Completed studies, scanner time, claims, payments and denials come from one database. Volume, use and revenue then tie to each other without spreadsheet merges.
2. Set the core measures
Leaders choose the measures that matter, such as studies per scanner per day, revenue per study by modality, authorization denial rate and days in AR. Each one has a target and a past-period baseline.
3. Compare with history and peers
Each measure is compared with the same period last year and with peer benchmarks. Gaps that are larger than normal variation are flagged for review.
4. Break each change into drivers
When a number moves, it is split into volume, payer mix, session reductions, equipment cuts and fee schedule effects. The largest driver is shown first, with the claims behind it.
5. Share and act
Findings go out through imaging reporting on a set schedule, and leaders explore them on imaging dashboards. Decisions on hours, staff, equipment and outreach are made from the same numbers.
Diagnostic Imaging Analytics Software vs. Generic Software
| Area | Generic approach | Unlimited Systems |
|---|---|---|
| Scanner use | Estimated by staff from memory. | Measured from booked and completed time by scanner. |
| Referrals | Noticed when volume has already dropped. | Trended by ordering NPI and practice. |
| Revenue per study | One average for the whole center. | Split by modality, component and payer, with drivers shown. |
| Payment rule effects | Session and equipment cuts hidden in adjustments. | Totaled and trended as their own drivers. |
| Benchmarks | None, or a vendor's general average. | Past periods and peer imaging groups. |
Who Uses It in a Diagnostic Imaging Practice
- Imaging center owner: Use and margin by scanner, so decisions on hours, staff and new equipment rest on data. Peer comparisons show where the center lags, and key revenue cycle measures sit beside them.
- Director of operations: Volume by site, modality and day part, so technologist schedules follow demand rather than habit.
- Physician liaison: A list of referring practices that are growing or fading, with the studies they send and how often those studies are denied.
Diagnostic Imaging Analytics Software FAQs
Imaging analytics usually starts with study volume by modality, scanner use, revenue per study, authorization denial rate and referral volume by ordering provider. Each is cut by site, payer and scanner. Together they show whether the equipment is busy enough, whether referrals are growing and whether payers are paying what the contracts say.
Scanner use is measured from booked and completed time on each unit, compared with the hours it is open. The view can be cut by day part and modality, so an MRI that sits idle every afternoon stands out. Owners can then change hours, move staff or add appointment types to fill the gap.
Revenue per CT can fall for several reasons. More patients may have had two studies in one session, which reduces payment for the later study. A payer may have moved patients into a benefit manager program. Older equipment may trigger the CT modifier cut, or the fee schedule may have changed. The analytics view shows each driver separately.
Referral patterns can be tracked by ordering provider and by practice, because imaging claims carry the ordering NPI. Leaders see which practices send more or fewer studies over time and which modalities they order. Denial rates by referrer also show where order quality or authorization habits need a conversation.
Imaging measures can be compared with peer benchmarks as well as the center's own history. Gaps that stand out, such as a higher authorization denial rate or lower revenue per MRI, are flagged. Leaders can then drill into the payers, sites or referrers behind the gap.
For 2026, CMS created two conversion factors, one for qualifying APM participants and one for everyone else. It also applied an efficiency adjustment to the work RVUs of non-time-based services, which covers most imaging reads. Analytics compares professional revenue per read across years with those changes shown as their own drivers.
Related Diagnostic Imaging Software
Analytics & value-based care
In the revenue cycle
Analytics for related specialties
Sources
- 42 CFR 424.507: Ordering covered imaging and clinical laboratory services
- 42 U.S.C. 1395w-4 (Social Security Act section 1848): Medicare physician fee schedule, including the special rules for imaging services
- CMS Medicare Claims Processing Manual, Chapter 13: Radiology Services and Other Diagnostic Procedures
- CMS Fact Sheet: Calendar Year 2026 Medicare Physician Fee Schedule Final Rule (CMS-1832-F)
- X12: Claim Adjustment Reason Codes
GET STARTED
See Unlimited Systems in Action
Whether you're actively evaluating new technology or simply preparing for your next vendor renewal, Unlimited Systems can help you understand where your current workflows may be creating avoidable revenue risk.