
Analytics & value-based care
Diagnostic Imaging Data Visualization Software
Dashboards that show idle scanner time, unsigned reads, authorization denials and referrer shifts, with a click from each tile to the claim line behind it.
Diagnostic Imaging Data Visualization Software turns imaging billing and operations data into dashboards that people can read at a glance and open for detail. Tiles show scanner time, studies waiting for a signed report, authorization denials, payer cuts and referring practices, and each one opens to the claims behind it.



 6,500+ specialty providers

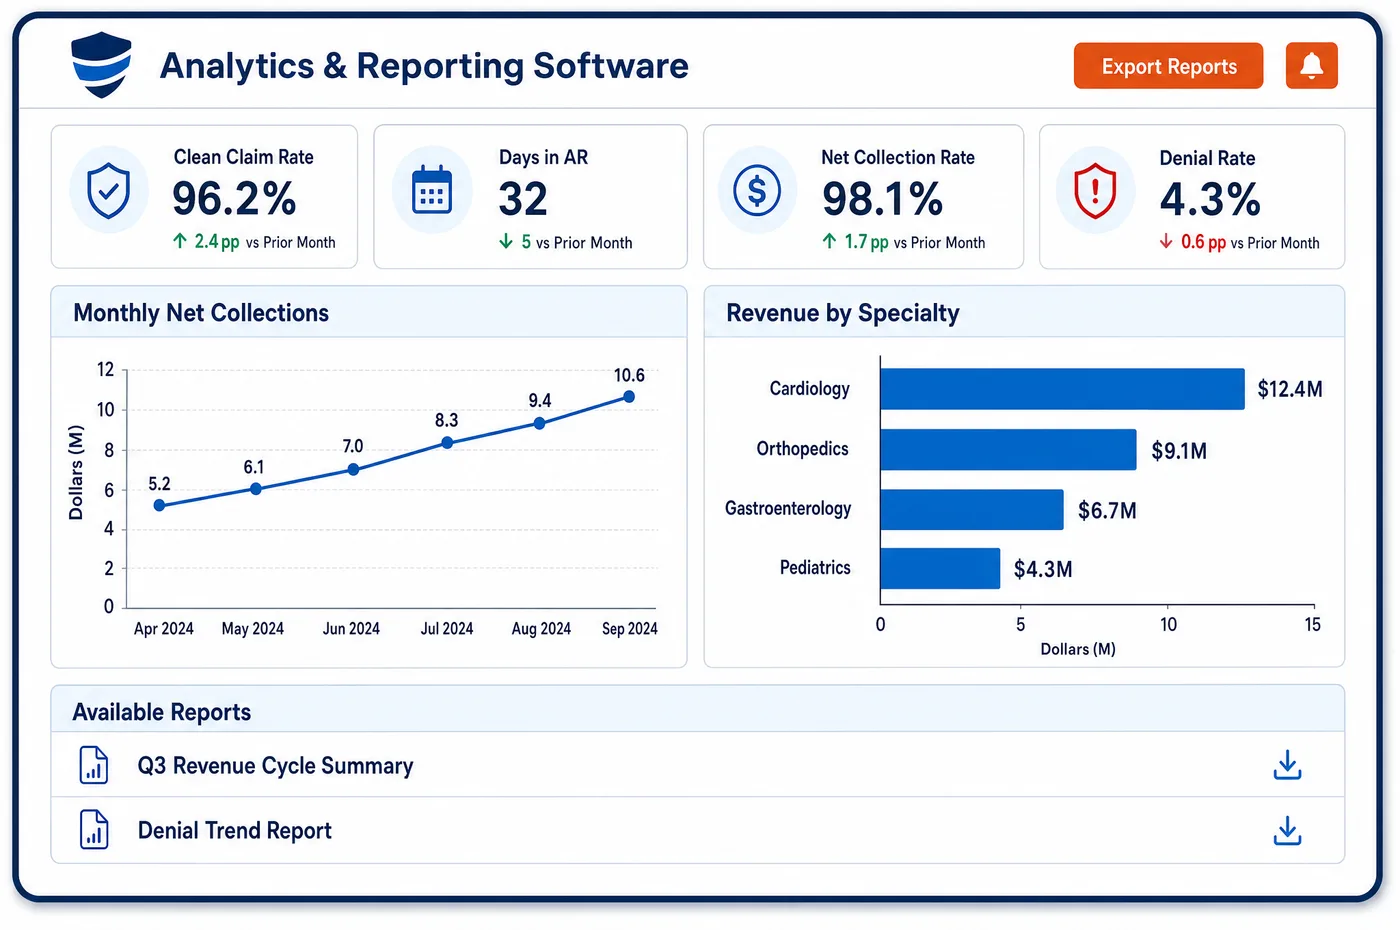
Data Visualization in a Diagnostic Imaging Practice
Good data visualization for imaging answers a question a manager asks before the first patient arrives. Which scanner has open slots this afternoon? How many finished studies still wait for a signed report, and so cannot be billed for the read? Which payer sent back the most authorization denials this week? Each answer sits on one tile, built from the same posted payments, claim lines and schedule data the billing team uses. Clicking a tile opens the list under it, down to the study, the modifier and the payer message. The practice chooses which tiles each role sees. A technologist lead sees scanner time and add-on slots. A billing manager sees denials by owner and aging by payer. An owner sees margin by modality and trends by referrer. Because every tile opens to its source, a number that looks wrong can be checked in a minute, and a number that looks right can be trusted.
Why Is Data Visualization Different in Diagnostic Imaging?
Imaging runs on a few expensive machines, so the first data visualization an owner wants is about time. An MRI that sits empty for two hours a day costs as much as one that runs full. A dashboard has to show booked time, completed time and open slots by scanner and by part of the day, and put the revenue those hours earned beside them. A table of monthly totals hides that pattern. A chart of one day, hour by hour, shows it at once.
The second view is the gap between work done and work billed. Medicare treats the interpretation of a diagnostic test as including a written report, so a read is not ready to bill until the report exists. A study can be finished, sit in a reading queue and drift past its filing limit without anyone noticing. A tile that counts finished studies with no signed report, sorted by age and by reading group, makes that backlog visible while it can still be fixed. The same tile shows which imaging workflow queues hold the most work.
The third use of data visualization is to look at the outside world. Referring practices, payers and hospital partners all change the numbers. A drop in volume may trace to one referring group, and a rise in denials may trace to one benefit manager. A dashboard that cuts every measure by ordering provider, payer and site lets leaders find the cause before the next meeting. The trends shown here come from imaging analytics, and the saved lists behind them come from imaging reporting.
What Diagnostic Imaging Data Visualization Software Handles
- Scanner time by day part
- Federal law has CMS assume a high utilization rate when it prices costly imaging equipment. A chart of booked, completed and open time by scanner and hour shows which units meet that level and which sit idle. (42 U.S.C. 1395w-4 (Social Security Act section 1848): Medicare physician fee schedule, including the special rules for imaging services)
- Studies awaiting a signed report
- Under Medicare, the professional component of a diagnostic test includes the interpretation and a written report. A tile counts completed studies with no final report, so the professional charge is not left unbilled. (CMS Medicare Claims Processing Manual, Chapter 13: Radiology Services and Other Diagnostic Procedures)
- Referrers by ordering NPI
- Claims for ordered imaging carry the ordering provider's legal name and NPI. A drill-down lists studies, payments and denials for each referring practice, so a change in volume can be traced to a name. (42 CFR 424.507: Ordering covered imaging and clinical laboratory services)
- Authorization denial trends (CARC 197 and 198)
- CARC 197 reports a missing authorization and CARC 198 reports a service beyond the one approved. A trend tile splits both by payer and modality and opens to the claim lines. (X12: Claim Adjustment Reason Codes)
- Screening to diagnostic callbacks
- Mammography facilities must track outcomes, including recall rate, cancer detection rate and positive predictive value. A billing tile shows screening volume and same-patient diagnostic follow-ups, and the audit team adds pathology from the clinical record. (21 CFR 900.12: Quality standards for mammography, including the medical outcomes audit)
- Equipment cut tiles (modifiers CT, FX, FY)
- Medicare pays less for CT on scanners that lack the NEMA XR-29 dose feature, for film X-rays and for computed radiography. A tile totals the lost payment by room, which gives owners a cost for keeping older equipment. (CMS Medicare Claims Processing Manual, Chapter 13: Radiology Services and Other Diagnostic Procedures)
How Does Diagnostic Imaging Data Visualization Software Work?
1. Pick the questions
The practice decides which questions each role asks every day, such as open scanner time, unsigned reads, denials by owner or aging by payer. Each one becomes a tile with a clear definition.
2. Connect each tile to the data
Tiles read posted payments, claim lines, the schedule and denial reasons from the same database. A total on a tile matches the same total in the ledger.
3. Set role views
Staff are given the tiles that fit their job, and the practice sets who can see patient-level detail. A scheduler sees open slots, while a controller sees margin by modality.
4. Drill down to the claim
A click opens the list behind a number, with the study, the component, the payer and the denial reason. Staff can fix the cause from that list instead of building a spreadsheet.
5. Review on a rhythm
Leaders review the same data visualization at the same time each week, and unusual moves are explained in imaging analytics. Lists that need to go to partners are sent through imaging reporting.
Diagnostic Imaging Data Visualization Software vs. Generic Software
| Area | Generic approach | Unlimited Systems |
|---|---|---|
| Scanner time | A monthly total of studies per unit. | Booked, completed and open time by scanner and hour. |
| Unbilled reads | Found at month end when a coder runs a list. | A running count of finished studies with no signed report. |
| Denials | A table sorted by date. | Trends by payer, modality and owner, opening to the claim line. |
| Referrers | Volume noticed after it falls. | Studies, payments and denials by ordering provider. |
| Role views | One report for everyone. | Tiles chosen for each role, with patient detail limited by the practice. |
Who Uses It in a Diagnostic Imaging Practice
- Imaging center manager: A morning view of open scanner time and add-on slots, so empty hours are filled before the day starts.
- Billing manager: A running list of studies waiting for a signed report and of denials by owner, with a click from each count to the claims. Trends come from imaging analytics.
- Radiology group owner: Margin by modality and a view of referring practices that are growing or fading, with the denial rate for each.
Diagnostic Imaging Data Visualization Software FAQs
Imaging data visualization should show open scanner time for the day, add-on slots, studies waiting for a signed report, and any authorization denials that came in overnight. Each tile opens to the list behind it. A manager can then fill gaps in the schedule and assign the day's urgent billing work in a few minutes.
A dashboard compares booked time, completed time and open slots for each scanner by hour and day. An MRI that is empty every afternoon stands out on a chart of one day. The revenue those hours earned sits beside the chart, so owners see what the idle time costs.
Under Medicare, the interpretation of a diagnostic test includes a written report, so the professional charge waits for the report. A tile that counts finished studies with no final report shows the size and age of that backlog. Reading groups can then clear the oldest ones before filing limits become a risk.
Claims for ordered imaging carry the ordering provider's name and NPI, so a dashboard can group denials by referring practice. A practice with many authorization denials stands out. The physician liaison can then offer that office help with approvals before more orders are denied.
Dashboards are for looking and exploring, while saved reports are for sending a fixed set of numbers to partners on a schedule. The two use the same data, so totals match. A hospital contact gets a report with the filters set for that contract, and does not see the practice's dashboards.
A click-through opens the list of claim lines that make up a number. It shows the study, the component billed, the payer, the payment and the denial reason, if any. Staff can correct a problem from that list, which is quicker than exporting data and matching it by hand.
Related Diagnostic Imaging Software
Analytics & value-based care
In the revenue cycle
Data Visualization for related specialties
Sources
- 42 U.S.C. 1395w-4 (Social Security Act section 1848): Medicare physician fee schedule, including the special rules for imaging services
- CMS Medicare Claims Processing Manual, Chapter 13: Radiology Services and Other Diagnostic Procedures
- 42 CFR 424.507: Ordering covered imaging and clinical laboratory services
- X12: Claim Adjustment Reason Codes
- 21 CFR 900.12: Quality standards for mammography, including the medical outcomes audit
GET STARTED
See Unlimited Systems in Action
Whether you're actively evaluating new technology or simply preparing for your next vendor renewal, Unlimited Systems can help you understand where your current workflows may be creating avoidable revenue risk.