

Analytics & value-based care
Dermatology Data Visualization Software
Live dashboards for Mohs days, path-pending claims, phototherapy courses, cosmetic sales and denials, with a click from any chart to the accounts behind it.
Dermatology Data Visualization Software turns a skin practice's live billing and operating data into dashboards each role can read at a glance. Mohs stage units, claims waiting on pathology, phototherapy sessions, cosmetic sales and denials by modifier are charted from the live database. Any bar or line opens the accounts behind it, so a chart leads straight to the work.



 6,500+ specialty providers

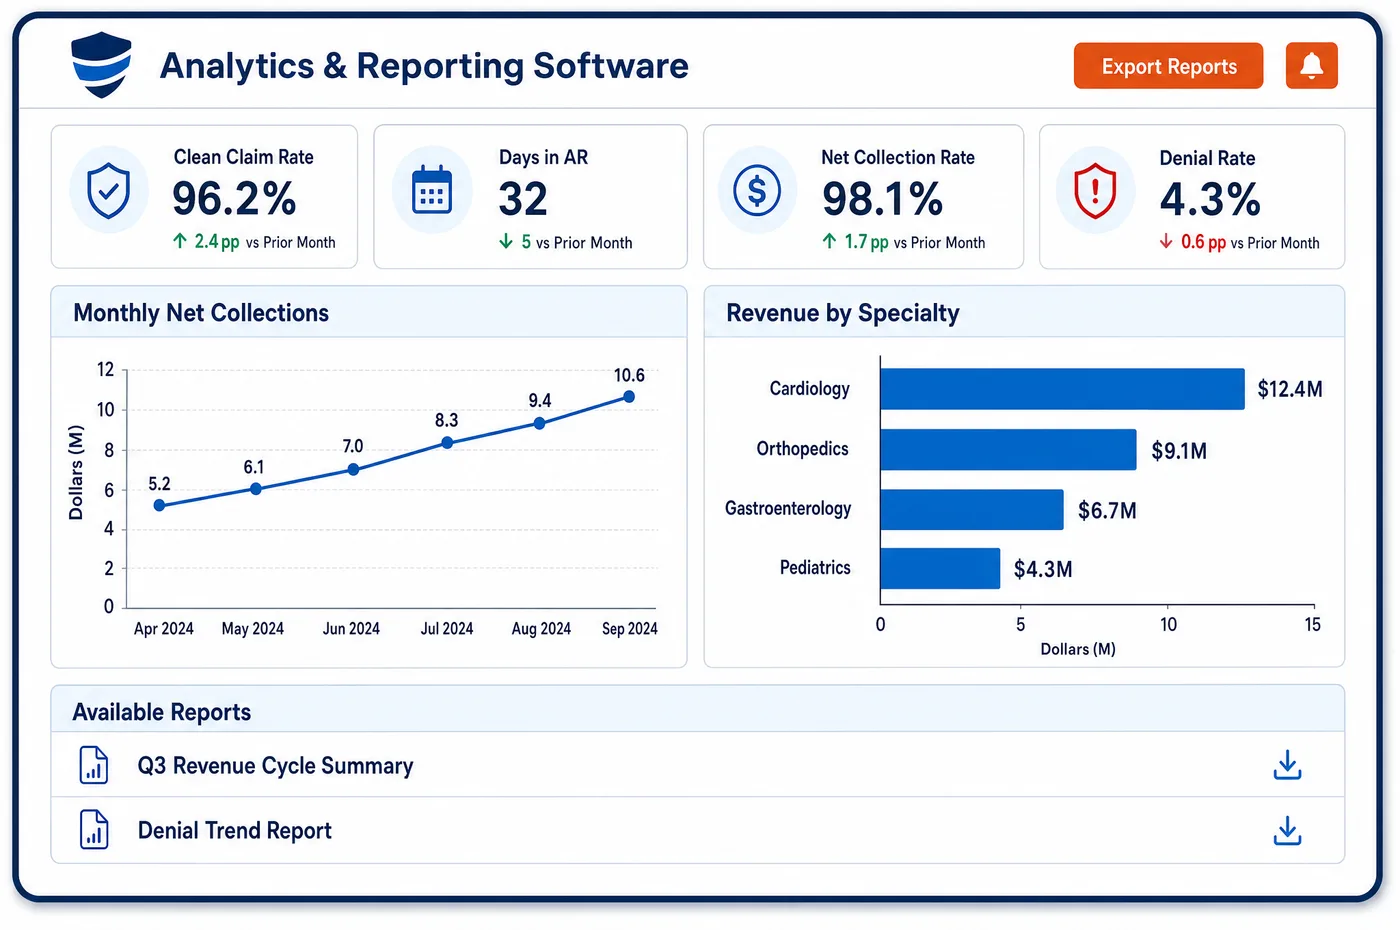
Data Visualization in a Dermatology Practice
Different people in a dermatology practice watch different things. A Mohs coordinator wants to see today's cases, stages billed and repairs still to be coded. A billing lead wants the number of excision claims held for a path report and how long they have waited. A phototherapy nurse wants to see which patients are close to their payer's session limit. An owner wants cosmetic and medical revenue by site, side by side. Unlimited Systems builds these views on a live connection to its own database, not a nightly export. Because the database records every change instead of overwriting it, a trend line shows how a number got where it is. Standard dashboards come ready to use, and custom dashboards cover views a practice adds for itself. Each chart links to the claims or accounts it counts, so users move from seeing a problem to fixing it without running a second report.
Why Is Data Visualization Different in Dermatology?
Dermatology data moves fast and in small pieces. A busy clinic can produce many biopsies, destructions and short visits in one day, plus a handful of large surgical claims. A dashboard built from yesterday's export is already out of date by mid-morning. Live views matter here because staff act on them during the day, not at the end of the month.
The things worth charting are specific to the specialty. Held claims waiting on pathology are invisible on most standard billing dashboards, because they haven't been billed yet. Mohs revenue depends on stage units, not just case counts. Phototherapy courses run against payer limits. Cosmetic sales follow demand and seasons. A generic chart of total charges and total collections tells a dermatology manager almost nothing they can act on.
Role views keep dashboards useful. A surgeon doesn't need the denial queue, and a payment poster doesn't need cosmetic sales by site. Giving each role a short, focused set of charts, with the option to drill down, keeps people looking at them. Data visualization in dermatology works best when every chart answers a question someone in the practice actually asks.
What Dermatology Data Visualization Software Handles
- Mohs day board
- For Medicare in WPS states, added stages bill as units of 17312 or 17314. A Mohs day board shows cases, stage units and repairs billed per surgeon, and links each case to its claim. (CMS Medicare Coverage Database, Billing and Coding Article A57477: Mohs Micrographic Surgery (WPS))
- Path-pending excision holds
- Benign excisions (11400 to 11471) and malignant excisions (11600 to 11646) are separate code families, so many claims wait for the path report. A held-claims chart shows how many there are and how old they are, as unbilled AR. (CMS NCCI Policy Manual for Medicare Services, Chapter III (Surgery: Integumentary System))
- Phototherapy course tracker
- Sessions are charted by code, from 96900 to the excimer codes 96920 to 96922. Payer limits sit on the same view, so staff see who is close to a cap. (Medica Coverage Policy: Light Treatment and Laser Therapies for Benign Dermatologic Conditions (codes 96900 to 96922))
- Cosmetic denial view
- Under the WPS LCD, benign lesion removal is covered when symptoms such as bleeding, itching or inflammation are documented. Cosmetic denials are charted by payer and provider, so documentation gaps stand out. (CMS Medicare Coverage Database, LCD L35498: Removal of Benign Skin Lesions (WPS))
- Melanoma recurrence panel (Q509)
- The 2026 Dermatological Care MVP includes Q509, Melanoma: Tracking and Evaluation of Recurrence. A panel shows melanoma patients due for a recurrence exam, by provider. (CMS Quality Payment Program: 2026 Finalized MIPS Value Pathways (Dermatological Care MVP))
How Does Dermatology Data Visualization Software Work?
1. Pick the questions
Each role starts with the questions it asks every day. A Mohs coordinator, a billing lead and an owner each get a short set of charts that answer theirs.
2. Connect to live data
Dashboards read from a live connection to the database. Numbers change as claims post, holds release and payments come in, with no nightly export in between.
3. Keep the history
The database records every change and never overwrites it. Trend lines show how a figure moved over time, so a manager can see when a payer's Mohs payments started to slip.
4. Drill to the accounts
Each chart links to the claims or accounts it counts. A spike in held claims opens the list of held claims, ready to work, and the deeper causes are in the analytics behind each chart.
5. Share the view
Dashboards are shared by role and site, and the same figures go out on paper through scheduled dermatology reports. Everyone sees one number, from the front desk to the owners.
Dermatology Data Visualization Software vs. Generic Software
| Area | Generic approach | Unlimited Systems |
|---|---|---|
| Data freshness | Yesterday's export. | A live connection to the database. |
| Held claims | Not shown, since they aren't billed yet. | Charted by age, with a link to each claim. |
| Mohs results | Case counts only. | Stage units and repairs per surgeon. |
| History | Records overwritten as they change. | Every change kept for trend lines. |
| Acting on a chart | Run a second report to find the accounts. | Click from the chart to the accounts. |
Who Uses It in a Dermatology Practice
- Billing lead: A held-claims chart, denial views by modifier and payer, and a click from each one to the claims to work. The billing RCM dashboard sits on the same data.
- Mohs coordinator: A day board with cases, stage units and repairs per surgeon, so coding gaps are fixed before the claim goes out.
- Owner or regional manager: Cosmetic and medical revenue by site, side by side, with trend lines that show when a site began to change.
Dermatology Data Visualization Software FAQs
A dermatology practice usually needs a Mohs day board, a held-claims view for excisions waiting on pathology, a phototherapy course tracker, cosmetic and medical revenue by site, and denials by modifier and payer. Each role gets the few charts it uses, with the option to drill down into the claims and accounts behind them.
Data visualization reads from a live connection to the platform's own database. Charts change as claims post, holds release and payments arrive. There is no nightly export, so a billing lead looking at held claims at noon sees the claims that are held at noon, not the ones held yesterday.
The database records every change instead of overwriting records. Trend lines can show how a figure moved day by day, such as how long one payer's Mohs payments have been slipping. Because history is never lost, a manager can see when a change began and look at the claims from that point on.
Standard dashboards come ready to use, and practices can build custom dashboards for their own needs. A group might add a cosmetic sales view by site, or a phototherapy view for one location. Custom dashboards use the same live data and the same links into the accounts as the standard ones.
Every chart links to the claims or accounts it counts. Clicking the bar for held excision claims opens the list of those claims. Clicking a denial trend opens the denied lines. Staff go from seeing a problem to working it without running a separate report or searching for accounts by hand.
Dashboards are shared by role and by site. A Mohs coordinator sees the day board, a billing lead sees held claims and denials, and an owner sees results across sites. Access follows the practice's structure, so a site manager sees their own sites while the group's leaders see the whole picture.
Related Dermatology Software
Analytics & value-based care
In the revenue cycle
Data Visualization for related specialties
Sources
- CMS Medicare Coverage Database, Billing and Coding Article A57477: Mohs Micrographic Surgery (WPS)
- CMS NCCI Policy Manual for Medicare Services, Chapter III (Surgery: Integumentary System)
- Medica Coverage Policy: Light Treatment and Laser Therapies for Benign Dermatologic Conditions (codes 96900 to 96922)
- CMS Medicare Coverage Database, LCD L35498: Removal of Benign Skin Lesions (WPS)
- CMS Quality Payment Program: 2026 Finalized MIPS Value Pathways (Dermatological Care MVP)
GET STARTED
See Unlimited Systems in Action
Whether you're actively evaluating new technology or simply preparing for your next vendor renewal, Unlimited Systems can help you understand where your current workflows may be creating avoidable revenue risk.