

Analytics & value-based care
Addiction Medicine Analytics Software
See retention, testing patterns, payer mix and denials together, so leaders know why an addiction program's numbers moved.
Addiction Medicine Analytics Software connects billing, scheduling and treatment data so leaders can see why revenue and retention move. It tracks weeks in treatment, gaps in medication, drug-test volume against payer rules, denials by reason and payer, and collections by funding source, with drill-down from each trend to the patients and claims behind it.



 6,500+ specialty providers

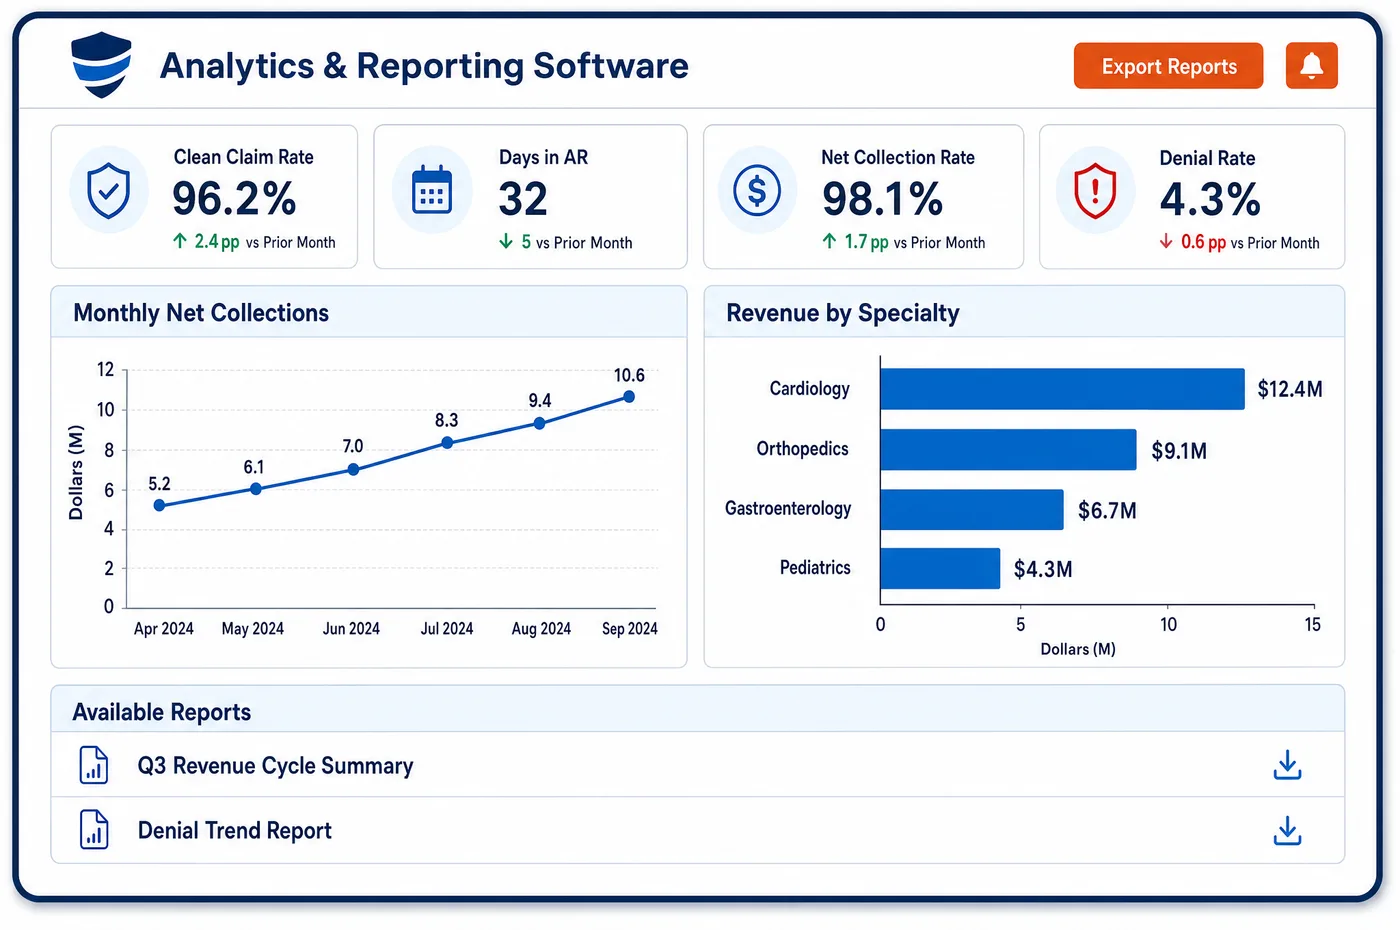
Analytics in a Addiction Medicine Practice
Most numbers in an addiction program trace back to one question: are patients staying in care? A drop in OTP revenue can mean fewer admissions, more patients leaving, a shift from methadone to buprenorphine bundles, or a payer that stopped paying an add-on. Analytics for addiction medicine pulls those threads apart. It counts weekly bundles billed per patient to show retention. It flags patients whose medication supply has a gap, the same gap that quality measures look for. It compares drug-test volume with the frequency a payer's policy expects for each treatment phase. It splits denials by reason and payer, including each carve-out vendor. It shows collections by insurance, grant, state contract and self-pay. Each view drills down from a total to the site, clinician, payer and claim, so managers can act on the cause instead of the symptom.
Why Is Analytics Different in Addiction Medicine?
Retention is both the main clinical goal and the main revenue driver. A patient who stays in care produces steady weekly or monthly claims, while one who leaves early produces a short run of claims and a gap. Measures such as MIPS 468 count continuous medication over a long period, so leaving early also hurts quality scores. Analytics that tie revenue to weeks in treatment show leaders where patients are being lost.
Drug testing is another place where patterns matter. Medicare contractor policy for SUD treatment ties expected test frequency to how long a patient has been abstinent, and it calls blanket orders not reasonable and necessary. A practice that tests every patient the same way may see rising denials and audit risk. Analytics that compare testing by phase and clinician find that pattern before a payer does.
Payer mix is unusual, too. Medicaid plans, carve-out vendors, Medicare, commercial plans, grants and self-pay can each be a large share. A change in one state contract or one carve-out vendor's policy can move the whole program. Seeing denial trends and collections by each source, in shared dashboards, shows which change matters.
What Addiction Medicine Analytics Software Handles
- Continuity of pharmacotherapy (MIPS 468)
- MIPS 468 counts adults with OUD medication who have at least one hundred eighty days of continuous treatment, with no gap of more than seven days. Analytics flag patients whose supply or injection timing is drifting toward a gap. (CMS QPP: 2026 Quality ID 468, Continuity of Pharmacotherapy for Opioid Use Disorder (MIPS CQM))
- SUD treatment initiation and engagement (IET)
- The IET measure tracks whether a new SUD episode leads to treatment within fourteen days, and to engagement within thirty-four days after that. New-patient funnels show where patients drop between intake and engagement. (Oregon Health Authority: 2026 Initiation and Engagement of SUD Treatment specification (follows HEDIS IET))
- Expected test frequency by phase (LCD L35006)
- Under the Novitas LCD for Medicare, expected presumptive testing runs from one to three tests a week early in treatment and one to three a month after ninety days of abstinence. Testing volume by phase and clinician is compared with that pattern. (CMS Medicare Coverage Database: LCD L35006, Controlled Substance Monitoring and Drugs of Abuse Testing (Novitas))
- Drug-test denials by reason (CARC 151, CARC 50)
- Frequency and necessity denials are trended by payer and ordering clinician. A rise in one reason points to its own fix, whether in ordering or in documentation. (X12 Claim Adjustment Reason Codes)
- OTP bundle mix (G2067, G2068, G0533, G2074)
- Weekly bundles are counted by code, so leaders see the mix of methadone, oral buprenorphine, injectable buprenorphine and non-drug weeks. A shift in mix explains revenue changes that totals hide. (CMS: Opioid Treatment Program (OTP) Billing and Payment)
- Carve-out payer performance
- Because states can carve behavioral health out of managed care, the same patient group may be paid by different vendors. Collections and denials are shown for each carve-out on its own. (MACPAC: Types of managed care arrangements (benefit carve-outs))
How Does Addiction Medicine Analytics Software Work?
1. Bring the data together
Claims, posted remits, schedules, visit types and funding sources flow into one data set. Each record keeps its site, clinician, program and payer.
2. Track the core KPIs
Weeks in treatment, medication gaps, denial rate, days in AR and collections by funding source are tracked over time. Each one has a target the practice sets.
3. Find the cause
When a number moves, managers drill from the total to the site, clinician, payer and claim. A drop in OTP revenue can be traced to admissions, discharges, bundle mix or a payer change.
4. Compare and benchmark
Results are compared with the practice's own history and with peer benchmarks where available. Testing patterns are compared with payer policy by treatment phase.
5. Share what matters
Findings move into scheduled program reports for leaders, funders and boards. Each audience gets the views it needs, with access set by role.
Addiction Medicine Analytics Software vs. Generic Software
| Area | Generic approach | Unlimited Systems |
|---|---|---|
| Retention | Measured only as active patient counts. | Weeks in treatment and medication gaps tracked per patient. |
| Drug testing | Test volume reported as one total. | Testing compared with payer policy by phase and clinician. |
| Denials | A single practice-wide denial rate with no breakdown. | Denials split by reason, payer and carve-out vendor. |
| Revenue changes | Explained after the fact in meetings. | Traced to admissions, bundle mix or payer change by drill-down. |
| Funding sources | Grant and self-pay mixed into other income. | Collections shown by insurance, grant, contract and self-pay. |
Who Uses It in a Addiction Medicine Practice
- Medical director: Retention, medication gaps and testing patterns by clinician, so care problems are seen alongside the numbers.
- Revenue cycle manager: Denials and collections by payer, reason and funding source, with drill-down to the claims behind each trend.
- Executive director: A clear view of which programs, sites and payers sustain the organization, with analytics that explain why results changed. Long-term trends feed value-based contract work.
Addiction Medicine Analytics Software FAQs
The analytics that matter most link revenue to retention. Weeks in treatment, medication gaps, new-patient engagement, drug-test volume by phase, denials by reason and payer, and collections by funding source cover most questions. Each should drill down from a total to the site, clinician, payer and claim, so the cause of a change can be found.
Billing data shows retention through the claims each patient produces over time. Weekly OTP bundles or monthly office-based codes form a run for each patient. A break in that run marks a gap or a discharge. Counting those runs by site and clinician shows where patients stay in care and where they leave early.
Analytics can compare drug-test volume with the frequency a payer's policy expects. The Novitas LCD for Medicare ties expected testing to time in recovery and rejects blanket orders. When one clinician or site tests far more often than the patient's phase calls for, the pattern shows up before denials and audits do.
MIPS 468 counts patients on OUD medication who stay on it for at least one hundred eighty days, with no gap of more than seven days. Analytics use refill, dosing and injection dates to show which patients are at risk of a gap. Staff can reach those patients before the gap breaks the streak.
Many states carve behavioral health out of managed care, so different vendors may pay for the same type of service. Each vendor has its own rules, rates and denial patterns. Tracking collections and denials for each one shows which vendor is causing a problem, rather than hiding it in a Medicaid total.
A sudden drop in OTP revenue usually comes from fewer admissions, more discharges, a change in bundle mix, or a payer that stopped paying a code. Analytics separate these causes by counting bundles by code, tracking admissions and discharges, and showing paid amounts by payer for each code. The real cause is then clear.
Related Addiction Medicine Software
Analytics & value-based care
In the revenue cycle
Analytics for related specialties
Sources
- CMS QPP: 2026 Quality ID 468, Continuity of Pharmacotherapy for Opioid Use Disorder (MIPS CQM)
- Oregon Health Authority: 2026 Initiation and Engagement of SUD Treatment specification (follows HEDIS IET)
- CMS Medicare Coverage Database: LCD L35006, Controlled Substance Monitoring and Drugs of Abuse Testing (Novitas)
- X12 Claim Adjustment Reason Codes
- CMS: Opioid Treatment Program (OTP) Billing and Payment
- MACPAC: Types of managed care arrangements (benefit carve-outs)
GET STARTED
See Unlimited Systems in Action
Whether you're actively evaluating new technology or simply preparing for your next vendor renewal, Unlimited Systems can help you understand where your current workflows may be creating avoidable revenue risk.