

Analytics & value-based care
Behavioral Health Analytics Software
See caseloads, units, time to services, authorization use and payer yield by clinician, program and site, and learn why they move.
Behavioral Health Analytics Software shows how an organization's clinicians, programs and payers are performing, and why the numbers change. It tracks caseloads, billable units, time to services, authorization use, no-shows, denials and payer yield across every discipline, from psychiatry to peer support. Leaders can see a problem while it can still be fixed.


 6,500+ specialty providers

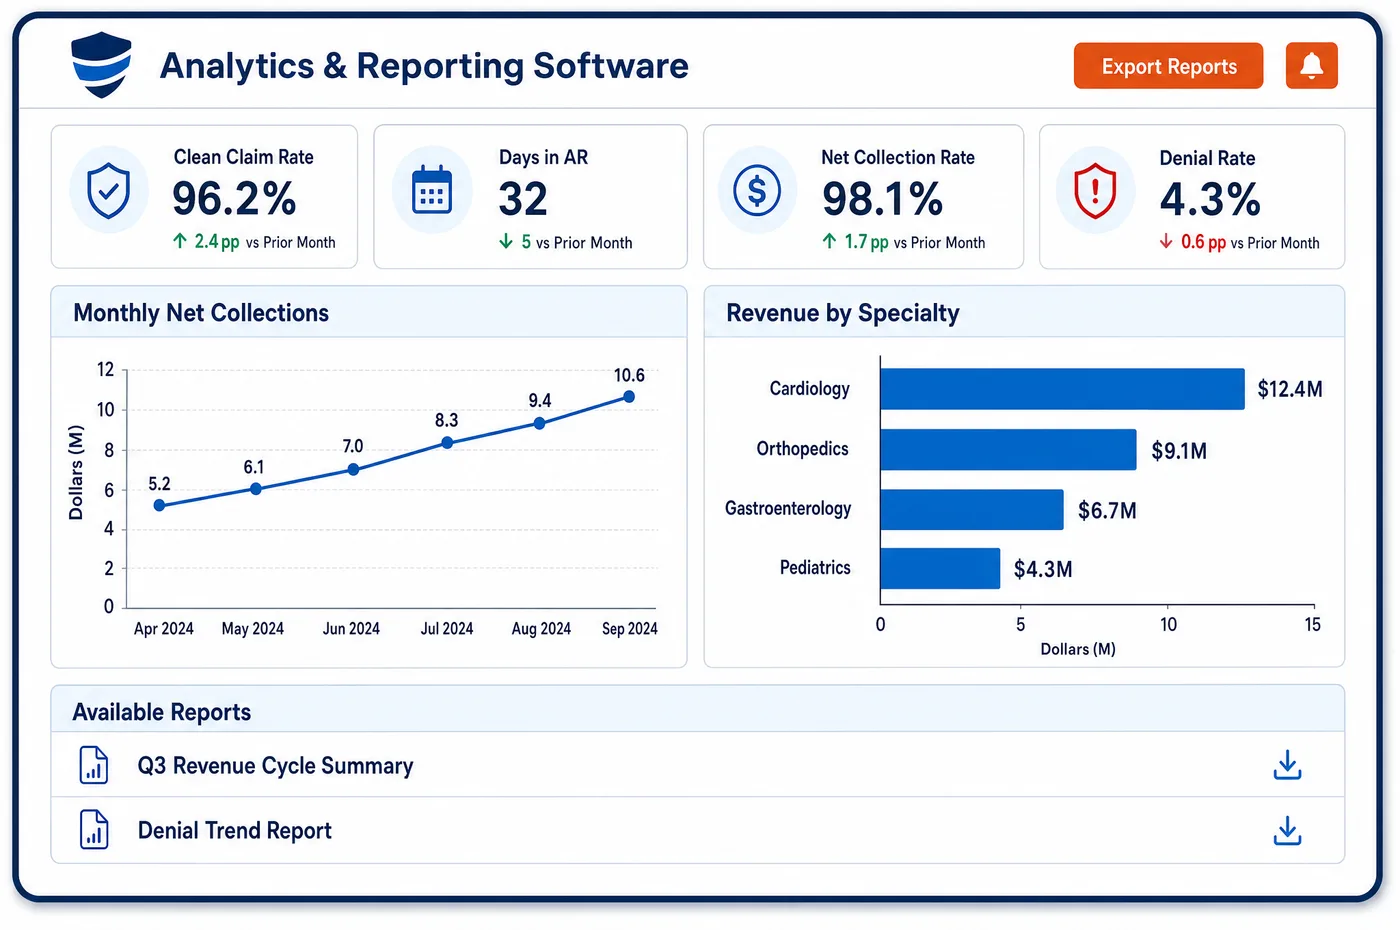
Analytics in a Behavioral Health Practice
Behavioral health analytics starts with people's time. A therapist bills timed sessions, a case manager bills time-based units, a peer specialist bills units in the community, and a prescriber bills visits. Unlimited Systems reads clinical, scheduling and billing data from one source, so productivity is measured in the way each role bills. Caseloads are shown with the date of each client's last contact. For CCBHCs, the time from first contact to evaluation and to first clinical service is tracked as clients come in. Authorization use shows how many approved units remain for each program. Denials and the denial rate are broken down by plan, code and modifier, and patterns are sent back to claim edits. Payer yield shows what each plan really pays per unit and per encounter. National benchmarks compare the organization with specialty peers, and every figure links back to the transactions behind it.
Why Is Analytics Different in Behavioral Health?
Productivity is hard to measure across a mixed team. A psychologist doing testing, a social worker doing family therapy and a peer specialist meeting a client at a shelter all do valuable work, but they bill in different units. A single visits-per-day number makes some roles look idle and others look busy. Behavioral health analytics has to compare each clinician with others in the same role and payer mix.
Access is a core measure, not a side issue. A CCBHC reports Time to Services (I-SERV), which measures the average time to an initial evaluation, to initial clinical services and to crisis services. Long waits also hurt revenue, because a client who waits is more likely to never start care. Analytics that shows open intake slots, waits by program and no-shows by modality helps leaders move staff to where demand is.
Revenue in behavioral health moves for reasons that are easy to miss. A plan can lower its unit rate at renewal, an authorization limit can cut off units mid-month, or a new clinician can be denied until plan enrollment finishes. For a CCBHC, the PPS rate depends on costs and visit counts, so a drop in visits can change future payment. Analytics has to separate those causes so leaders fix the real one.
What Behavioral Health Analytics Software Handles
- Time to Services (I-SERV)
- I-SERV has three submeasures: time to initial evaluation, to initial clinical services and to crisis services. The dates come from scheduling and the record, and averages are shown by program and site. (SAMHSA: Quality Measures for Behavioral Health Clinics, Technical Specifications and Resource Manual (2024))
- Per-unit services such as H2017 and T1016
- Psychosocial rehabilitation (H2017) and case management (T1016) are billed per 15 minutes in programs such as Arizona Medicaid. Productivity for those roles is measured in units billed against scheduled time. (AHCCCS (Arizona Medicaid) Covered Behavioral Health Services Guide, effective October 1, 2026)
- Practitioner modifiers by credential
- Ohio Medicaid uses practitioner modifiers, such as HN and HO for qualified mental health specialists at the bachelor's and master's level, to price services and count soft limits. Units and yield can be grouped by those modifiers to compare roles fairly. (Ohio Department of Medicaid: Behavioral Health State Plan Services Provider Requirements and Reimbursement Manual, version 1.28.1 (Table 1-3, practitioner modifiers))
- CC PPS-1 and CC PPS-2 rate math
- The CCBHC rate is total allowable costs divided by daily or monthly visits. Cost per visit is tracked during the year, next to the rate in effect. (CMS: Section 223 CCBHC Demonstration PPS Guidance (updated February 2024))
- CARC 198 trends by program
- Exceeded-authorization denials are trended by program, plan and month. A rise points to authorizations that run out before treatment plans end. (X12 Claim Adjustment Reason Codes)
How Does Behavioral Health Analytics Software Work?
1. Bring the data together
Clinical, scheduling and billing data are read from one source, with no weekly merge of exports. Each figure keeps a link to the transactions behind it.
2. Measure each role its own way
Productivity is shown as sessions, units or visits, depending on how the role bills. Clinicians are compared within their role and program.
3. Watch access
Time to first evaluation and first service, open intake slots and no-shows are tracked by program, site and modality. Long waits are visible as they build.
4. Find why revenue moved
Changes are split into volume, rate, denials and authorization limits. Denial patterns go back to claim edits, and the results show up in scheduled reports.
5. Compare and share
National benchmarks show how the organization compares with specialty peers. Leaders explore the results on role-based dashboards.
Behavioral Health Analytics Software vs. Generic Software
| Area | Generic approach | Unlimited Systems |
|---|---|---|
| Productivity | One visits-per-day target for every role. | Sessions, units or visits measured the way each role bills. |
| Access | Wait times guessed from staff reports. | Time to evaluation and first service tracked by program. |
| Authorizations | Units found to be used up when claims deny. | Units remaining shown by program and plan. |
| Revenue changes | A single total that rose or fell. | Changes split into volume, rate, denials and limits. |
| Benchmarks | No outside comparison. | National benchmarks against specialty peers. |
Who Uses It in a Behavioral Health Practice
- Clinical director: Caseloads with last-contact dates, time to services and no-shows by program, so staff go where clients are waiting.
- Program manager: Units used against authorizations and productivity by role, compared with peers in the same program.
- CEO or CFO: Payer yield, denial causes and cost per visit in one place, with value-based measures alongside.
Behavioral Health Analytics Software FAQs
Behavioral health analytics measures caseloads, productivity by role, time to services, no-shows, authorization use, denials and payer yield. It reads clinical, scheduling and billing data from one source. Leaders can see each measure by clinician, program, site and payer, and each figure links back to the transactions that make it up.
Productivity is measured the way each role bills: timed sessions for therapists, time-based units for case managers and peer staff, and visits for prescribers. Each clinician is compared with others in the same role, program and payer mix. That avoids a single visits-per-day target that treats a peer specialist and a psychiatrist as the same job.
Time to an initial evaluation, to first clinical services and to crisis services can be tracked from scheduling and record dates. Those are the three parts of the I-SERV measure that CCBHCs report. Averages are shown by program and site, so leaders see where waits are growing before the reporting year ends.
Analytics splits a revenue change into its causes: fewer sessions or units, a lower rate from a plan, more denials, or authorizations that ran out. Each cause links to the claims behind it. A drop driven by one plan's rate change looks very different from one driven by a new clinician's enrollment gap.
National benchmarks compare measures such as denial rates, days in AR and collection rates with regional and national specialty averages. Benchmarks show where the organization is out of line. The organization's own trends then show whether a change is working.
Analytics finds what changed and why. Reporting delivers the standard and required reports on a schedule. Dashboards give each role a live view it can drill into. All three read the same data, so a number on a dashboard matches the number in the board report.
Related Behavioral Health Software
Analytics & value-based care
In the revenue cycle
Analytics for related specialties
Sources
- SAMHSA: Quality Measures for Behavioral Health Clinics, Technical Specifications and Resource Manual (2024)
- AHCCCS (Arizona Medicaid) Covered Behavioral Health Services Guide, effective October 1, 2026
- Ohio Department of Medicaid: Behavioral Health State Plan Services Provider Requirements and Reimbursement Manual, version 1.28.1 (Table 1-3, practitioner modifiers)
- CMS: Section 223 CCBHC Demonstration PPS Guidance (updated February 2024)
- X12 Claim Adjustment Reason Codes
GET STARTED
See Unlimited Systems in Action
Whether you're actively evaluating new technology or simply preparing for your next vendor renewal, Unlimited Systems can help you understand where your current workflows may be creating avoidable revenue risk.