

Analytics & value-based care
Psychiatry Data Visualization Software
Live psychiatric dashboards for each role, with one click from any chart to the accounts and visits behind it.
Psychiatry Data Visualization Software turns scheduling, billing and outcome data into live dashboards for each role in a psychiatric practice. Clinicians see symptom score trends, care managers see their collaborative care registry, and billing staff see denials by carve-out. Every chart links straight to the patients, visits and claims behind it.



 6,500+ specialty providers

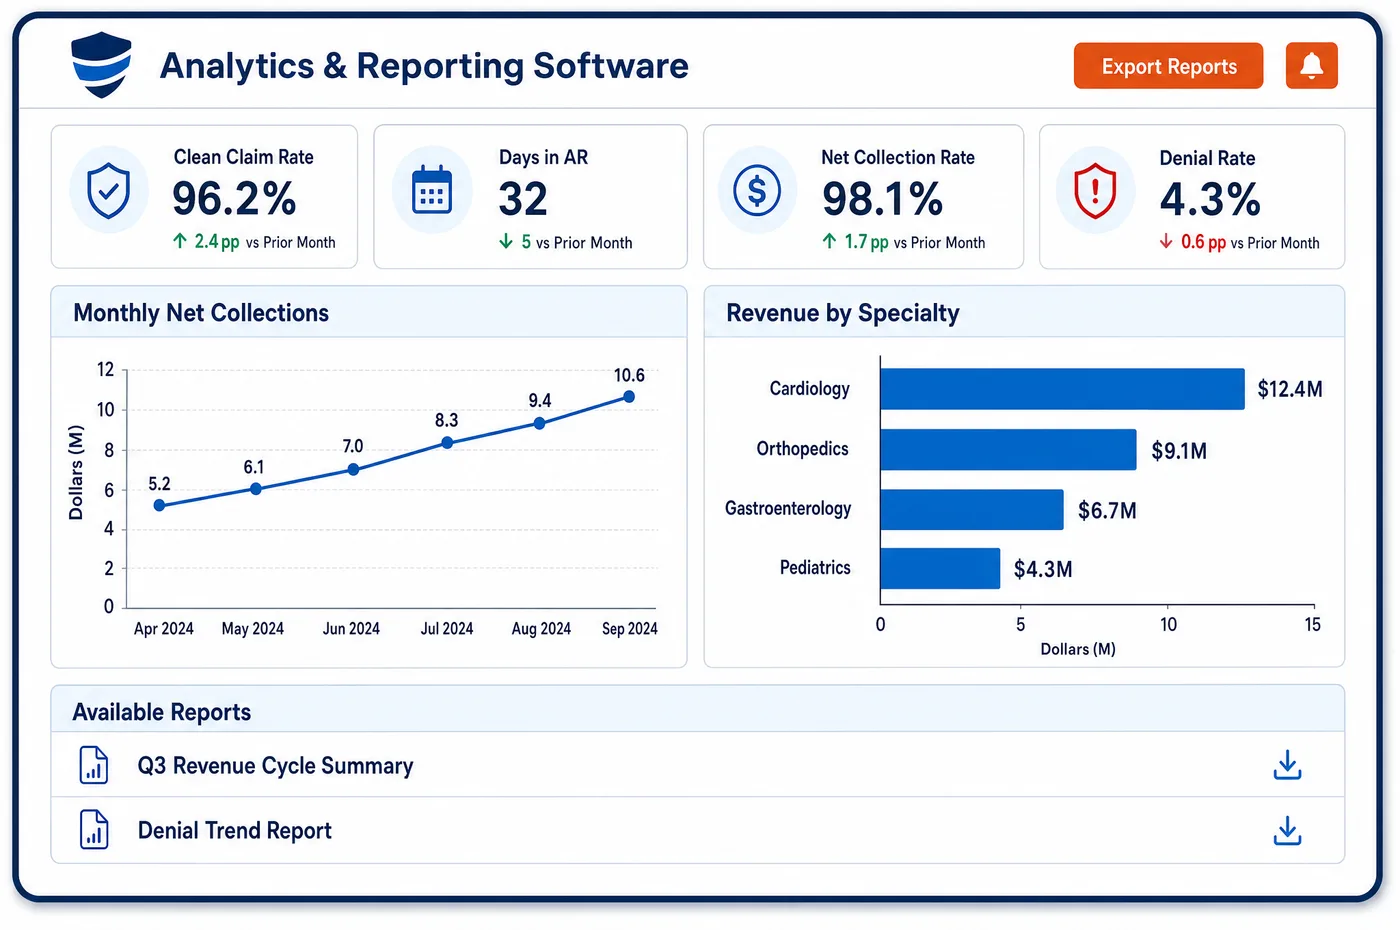
Data Visualization in a Psychiatry Practice
One psychiatric practice needs very different views. A front desk lead watches today's video and in-person visits and the no-shows piling up. A medical director looks at PHQ-9 trend lines by clinician. A billing manager wants denials by payer, with each behavioral health carve-out on its own row. Unlimited Systems builds these dashboards on a live connection to its own database, so the numbers are current, not last night's export. The database is an event store that never overwrites history, so a chart can show how an account or a measure changed over time. Each chart is a door, not a wall. A click on a bar of denied add-on lines opens the claims behind it. Standard dashboards come ready, and custom ones can be built for a TMS program or a collaborative care team. Recurring report delivery sits with psychiatry reporting, and the measures themselves come from practice analytics.
Why Is Data Visualization Different in Psychiatry?
Psychiatric data is spread across roles that rarely sit together. Care managers, prescribers, therapists, schedulers and billers each touch a different part of the same patient's care. One dashboard for everyone ends up useful to no one. Data visualization in psychiatry works when each role opens a view built around its own daily decisions.
Trends matter more than snapshots. A single PHQ-9 score says little, while a line of scores across sessions shows whether treatment is working. The same holds for no-shows across a season or add-on denials across a quarter. Charts need history, and history needs a database that keeps every change instead of overwriting it.
Sensitive data needs care on screen as well as on paper. Substance use disorder records under 42 CFR Part 2, and details from therapy, deserve tighter access than a billing total. Dashboards that draw on clinical data should follow role-based HIPAA access and location rules, so a user sees only the patients and sites their job covers.
What Psychiatry Data Visualization Software Handles
- PHQ-9 trend lines
- Total scores stored as LOINC 44261-6 plot across sessions for each patient and roll up by clinician. A flat or rising line is easy to spot. (LOINC 44261-6: PHQ-9 total score)
- Collaborative care registry view
- Collaborative care relies on a registry to track each patient's progress. The view shows enrolled patients, latest scores and minutes this month against the 99492 and 99493 thresholds. (CMS MLN909432: Behavioral Health Integration Services)
- Telehealth mix by POS 02 and POS 10
- Charts split visits and payments by place of service and by modifier 95 or 93. Shifts between video and audio-only care are visible week to week. (CMS Medicare Claims Processing Manual, Chapter 26)
- Denials by CARC and carve-out
- A grid shows denial reason codes such as 197 and 109 by payer. Clicking a cell opens the claims behind it. (X12 Claim Adjustment Reason Codes)
- TMS course tracker
- Each TMS patient's sessions billed under 90868 appear against the authorized count. Courses close to their limit stand out. (CMS Billing and Coding Article A57647: Transcranial Magnetic Stimulation)
- Part 2 access on dashboards
- Views that could reveal substance use disorder records follow role and location limits. Users see only the patients and sites their job covers. (HHS: Confidentiality of Substance Use Disorder Patient Records (42 CFR Part 2))
How Does Psychiatry Data Visualization Software Work?
1. Pick the role view
Each user opens a standard revenue cycle dashboard built for their role. Owners, directors, care managers and billers each start somewhere different.
2. Read live data
Charts read from a live connection to the Unlimited Financials database. What a user sees reflects what was posted or booked moments ago.
3. Look at the trend
Trend views use the event-store history, so nothing has been overwritten. A measure can be shown across any period the practice picks.
4. Drill to the record
Any bar, line or cell links to the accounts, visits or claims behind it. Staff move from the chart to the work in one click.
5. Build a custom view
Teams can build their own dashboards for a TMS program, a Spravato clinic or a collaborative care team. Trend analysis tools come with each one.
6. Hand off the work
Problems found on a chart go to the person who owns them. The fix happens in the staff work queues, not in a spreadsheet.
Psychiatry Data Visualization Software vs. Generic Software
| Area | Generic approach | Unlimited Systems |
|---|---|---|
| Data freshness | Charts built from a nightly export. | Charts on a live database connection. |
| History | Old values overwritten when records change. | Event store keeps every change for trend views. |
| Drill-down | A chart shows a problem, and a second report finds the accounts. | One click from the chart to the accounts. |
| Role views | One dashboard for the whole practice. | Views built for each role's decisions. |
| Clinical data | Scores kept apart from the business view. | PHQ-9 and GAD-7 trends beside access and revenue. |
Who Uses It in a Psychiatry Practice
- Medical director: Score trends by clinician and condition, and a collaborative care registry view, without waiting for a report.
- Billing manager: Denials by reason and carve-out, AR by aging bucket, and a click from any cell to the claims to work.
- Practice owner: Revenue and volume by service line, from therapy to TMS and Spravato, with the trend over time.
Psychiatry Data Visualization Software FAQs
A psychiatry practice usually needs at least four views: a front desk view of today's visits and no-shows, a clinical view of symptom score trends, a collaborative care registry, and a billing view of denials and AR by payer. Owners add a service-line view. Each one should link to the records behind its numbers.
Data visualization shows treatment progress as a line of PHQ-9 or GAD-7 scores across sessions. Each patient's line can be read on its own, and lines roll up by clinician and condition. A flat or rising line is easy to spot, so the care team can review that patient's plan.
The dashboards read from a live connection to the platform's database rather than a nightly copy. A payment posted, a visit booked or a claim denied shows up the next time the chart refreshes. Leaders look at today's figures, not yesterday's, when they decide what to do next.
Every chart links to the accounts, visits or claims that make it up. A billing manager who sees a spike in denied add-on lines can click the bar and open those claims. That turns a dashboard from a picture into a starting point for work.
Dashboards follow role-based permissions and location-based security. A user sees only the patients and sites their job covers, and views that could reveal substance use disorder records are limited further. Clinical detail stays with the care team, while billing users see the financial data they need.
Custom dashboards can be built for any program a practice runs. A TMS view might show sessions given against authorizations, while a Spravato view might show doses, payer mix and margin. Each custom view comes with trend tools and links into the records, just like the standard ones.
Related Psychiatry Software
Analytics & value-based care
In the revenue cycle
Data Visualization for related specialties
Sources
- LOINC 44261-6: PHQ-9 total score
- CMS MLN909432: Behavioral Health Integration Services
- CMS Medicare Claims Processing Manual, Chapter 26
- X12 Claim Adjustment Reason Codes
- CMS Billing and Coding Article A57647: Transcranial Magnetic Stimulation
- HHS: Confidentiality of Substance Use Disorder Patient Records (42 CFR Part 2)
GET STARTED
See Unlimited Systems in Action
Whether you're actively evaluating new technology or simply preparing for your next vendor renewal, Unlimited Systems can help you understand where your current workflows may be creating avoidable revenue risk.